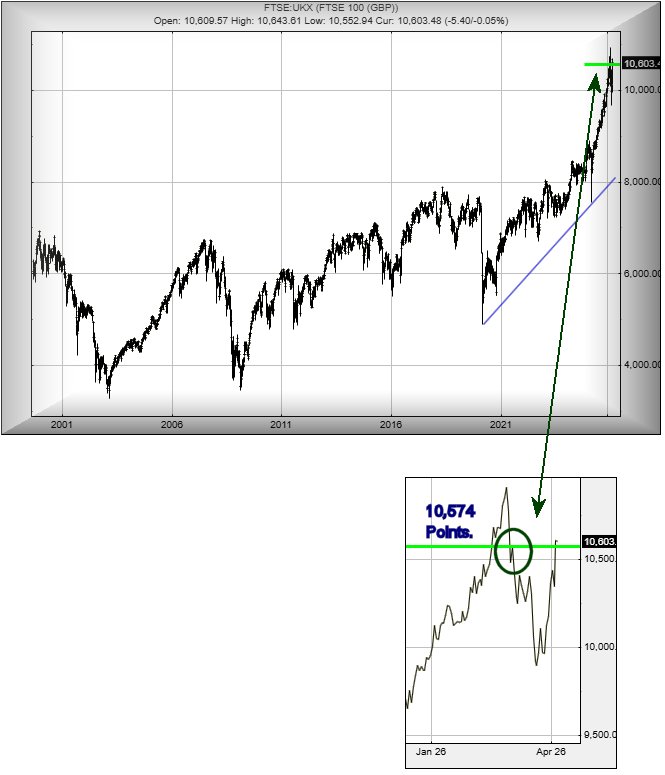
#FTSE #Gold Rather a few journalists have described current events on the FTSE as “a market correction”, “a steep drop”, “a reversal of fortunes”, and even “part of a global sell off”. The chart below, from our perspective, is utterly fascinating, showing all the various dance steps since 2001 with proper reversals displayed in detail. The FTSE recently falling to levels not seen since a few months ago doesn’t really comprise circumstances of disaster, despite what the folk creating clickbait headlines would have you believe.
There is something potentially really important – again from our perspective. It’s the thick Green line at 10,574 points, utterly unexpected as a point at which the FTSE should be worth paying attention to. This number is quite absurd, calculating from movements generated since 2001, a quite silly 25 years ago. To cut a 25 year old story short, the highest the FTSE should have been able to achieve was 10,574 points and normally, we would anticipate some turbulence at such a ridiculous level. What’s crazy is this logic appears to have worked out, the market solidly closing above 10,574, retreating below the target level, even doing a dinky little backtest of the target (circled on chart extract) and in the last couple of sessions, once again closing above 10,574 points. In addition, the level of the FTSE has managed above the level of the historic trend break around 10,375 in March, ticking a fairly important box for us now to anticipate even more FTSE gains.
Perhaps it shall be the case, where the UK Prime Minister indeed launches a fleet of rowing boats to chaperone vessels through the Straits of Hormuz, probably boasting green credentials by re-using craft which had previously carried illegal folks from France,an unsafe country according to refugee logic, for faux safety which is the UK. It’s all utterly insane.
We keep moaning about Clickbait Headlines and last weekends storm once again provided the Met Office with a chance to exaggerate things. Here on Scotlands wet West Coast, we were promised 90mph winds, Eskimo levels of snow, Biblical rainfall, and leaflets from the local LibDems. The only thing which actually happened was the LibDems stuffed their rubbish in our letter box which is conveniently located beside our two wheelie bins at the bottom of the drive. If we’d paid for “Storm Dave”, we’d want our money back! Whereas today, we’d epic rainfall, strong winds, then a storm which turned everything white and cold for a while. And then the sun came out and the growing grass made an unpleasant appearance again. None of this had been mentioned by the Met Office, their icon showing Cloudy Rain as an Argyll forecast.
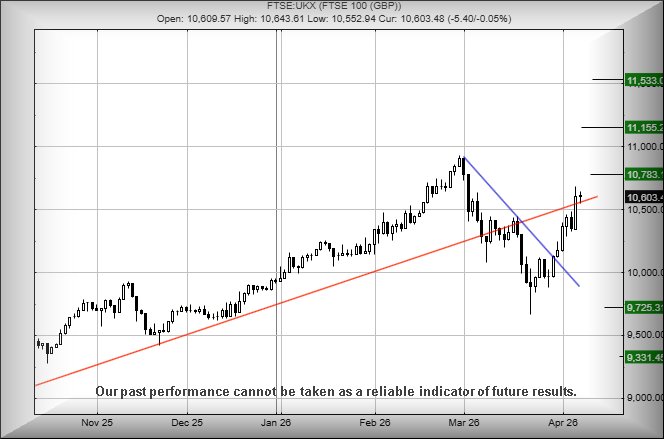
Anyway, our contribution to Clickbait is to suggest the FTSE is probably heading over 11,000 points next. Even from an immediate viewpoint, above 10,688 points calculates with the potential of a lift to an initial 10,783 points with our secondary, if bettered, at 11,155 points. While we’d ordinarily prefer avoid proposing 500 point days for the FTSE, it’s quite difficult to ignore immediate market forces. If triggered, the tightest stop loss level works out at 10,550 points.
If things intend follow the mood of Formula1 fans, hating a month without races (watching a Iranian drone chasing an F1 car would be interesting), below 10,090 points risks triggering reversals down to an initial 9,725 points with our secondary, if broken, at a less believable 9,331 points. We’re not sold on the concept of reversals, quite the opposite. But unfortunately, the market has plenty of wiggle room in which it can pretend something useful is happening.
FUTURES
FUTURES
| Time Issued | Market | Price At Issue | Short Entry | Fast Exit | Slow Exit | Stop | Long Entry | Fast Exit | Slow Exit | Stop | Prior |
| 11:38:11PM | BRENT | 9310.7 | 8754 | 8627 | 9310 | 9642 | 10253 | 9329 | ‘cess | ||
| 11:41:07PM | GOLD | 4762.38 | 4696 | 4632 | 4738 | 4804 | 4899 | 4758 | |||
| 11:43:19PM | FTSE | 10597 | 10549 | 10507 | 10594 | 10641 | 10664 | 10611 | |||
| 11:50:39PM | STOX50 | 5902.8 | 5869 | 5844 | 5898 | 5929 | 5956 | 5896 | |||
| 10:56:03PM | GERMANY | 23868.2 | 23663 | 23440 | 23851 | 23965 | 24056 | 23824 | ‘cess | ||
| 10:58:56PM | US500 | 6815 | 6739 | 6712 | 6777 | 6835 | 6849 | 6805 | ‘cess | ||
| 11:03:04PM | DOW | 48148 | 47542 | 47353 | 47774 | 48316 | 48499 | 47778 | Success | ||
| 11:08:56PM | NASDAQ | 25030.6 | 24785 | 24576 | 24887 | 25100 | 25190 | 24960 | |||
| 11:11:09PM | JAPAN | 56533 | 55758 | 55030 | 55970 | 57040 | 57606 | 56520 |
9/04/2026 FTSE Closed at 10603 points. Change of -0.05%. Total value traded through LSE was: £ 6,549,262,704 a change of -39.09%
8/04/2026 FTSE Closed at 10608 points. Change of 2.51%. Total value traded through LSE was: £ 10,752,106,847 a change of 44.19%
7/04/2026 FTSE Closed at 10348 points. Change of -0.84%. Total value traded through LSE was: £ 7,456,687,194 a change of 2.69%
2/04/2026 FTSE Closed at 10436 points. Change of 0.69%. Total value traded through LSE was: £ 7,261,693,815 a change of -29.12%
1/04/2026 FTSE Closed at 10364 points. Change of 1.85%. Total value traded through LSE was: £ 10,245,214,633 a change of 9.62%
31/03/2026 FTSE Closed at 10176 points. Change of -100%. Total value traded through LSE was: £ 9,345,809,311 a change of 0%
30/03/2026 FTSE Closed at 10127 points. Change of 0%. Total value traded through LSE was: £ 7,880,014,253 a change of 0% 
SUCCESS above means both FAST & SLOW targets were met. ‘CESS means just the FAST target met and probably the next time it is exceeded, movement to the SLOW target shall commence.
Our commentary is in two sections. Immediately below are today’s updated comments. If our commentary remains valid, the share can be found in the bottom section which has a RED heading. Hopefully, this will mean you no longer need to flip back through previous reports. HYPERLINKS DISABLED IN THIS VERSION
Please remember, all prices are mid-price (halfway between the Buy and Sell). When we refer to a price CLOSING above a specific level, we are viewing the point where we can regard a trend as changing. Otherwise, we are simply speculating on near term trading targets. Our website is www.trendsandtargets.com.
UPDATE. We often give an initial and a secondary price. If the initial is exceeded, we still expect it to fall back but the next time the initial is bettered, the price should continue to the secondary. The converse it true with price drops.
We can be contacted at info@trendsandtargets.com. Spam filters set to maximum so only legit emails get through…
Section One – Outlook Updated Today. Click here for Section Two – Outlook Remains Valid shares
Click Epic to jump to share: LSE:FOXT Foxtons** **LSE:ITM ITM Power** **LSE:ONT Oxford Nanopore Tech** **LSE:SFOR S4 Capital** **
********
Updated charts published on : Foxtons, ITM Power, Oxford Nanopore Tech, S4 Capital,
LSE:FOXT Foxtons Close Mid-Price: 42.45 Percentage Change: -1.21% Day High: 43.5 Day Low: 42.3
If Foxtons experiences continued weakness below 42.3, it will invariably ……..
</p
View Previous Foxtons & Big Picture ***
LSE:ITM ITM Power. Close Mid-Price: 69 Percentage Change: + 7.14% Day High: 75.05 Day Low: 68
All ITM Power needs are mid-price trades ABOVE 75.05 to improve accelerat ……..
</p
View Previous ITM Power & Big Picture ***
LSE:ONT Oxford Nanopore Tech Close Mid-Price: 104.5 Percentage Change: -8.73% Day High: 115.9 Day Low: 104
In the event Oxford Nanopore Tech experiences weakness below 104 it calcu ……..
</p
View Previous Oxford Nanopore Tech & Big Picture ***
LSE:SFOR S4 Capital. Close Mid-Price: 36.9 Percentage Change: + 5.58% Day High: 37.25 Day Low: 34.5
Target met. Further movement against S4 Capital ABOVE 37.25 should improv ……..
</p
View Previous S4 Capital & Big Picture ***