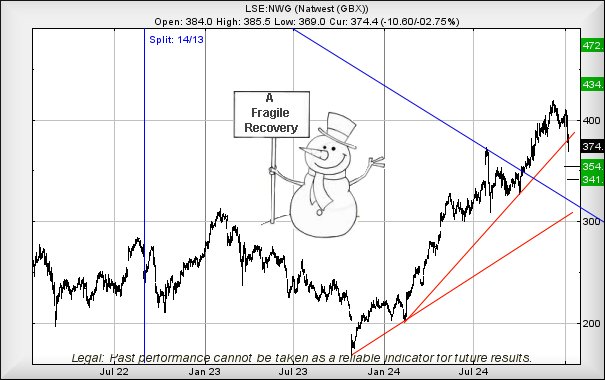
#Brent #Dax When we reviewed Natwest a few weeks ago, we laid out some criteria for a price reduction to 373p, a target achieved just yesterday. During the course of the session, the price even managed to break our 373p target, hitting a low of 369p, doubtless causing more panic than a sharp knock on the front door after posting a funny political cartoon on Twitter! Now, there’s ample reason for some debate as to what’s next?
As the chart shows, by closing the session at 374.4p, Natwest managed to end the session below the immediate Red uptrend (currently 381p), placing the share price in a zone where further trouble should be anticipated in the future. To be realistic, we can allocate a trigger level at 367p as below such a point risks tipping the scales in favour of a visit t an initial 354p with our secondary, if broken, a bottom down at a painful 341p and hopefully a solid bounce. It’s interesting to note, when we paint a Blue downtrend since 2007 onto the chart, when the bank was known as Royal Bank of Scotland (RBS), there’s an arguable bounce point at 345p, the level of the most recent trend break in October last year.
So, what should be expected in a scenario, where Natwest reverses to around 341p and actually bounces? We can calculate an initial longer term 434p with our secondary, should such an ambition be exceeded, working out at a distant looking 472p and some almost certain hesitation.
Overall, similar to the other retail banks, the financial sector actually is currently lodging in a zone, where some long term optimism is permitted. Hopefully the current UK Government, always keen to damage business, doesn’t discover a new and exciting way to derail this rare chance for “proper” share price movements.
FUTURES
FUTURES
| Time Issued | Market | Price At Issue | Short Entry | Fast Exit | Slow Exit | Stop | Long Entry | Fast Exit | Slow Exit | Stop |
| 11:39:49PM | BRENT | 8080.9 | 7834 | 7738 | 7606 | 7980 | 8101 | 8331 | 8763 | 7630 |
| 11:43:03PM | GOLD | 2688.43 | ||||||||
| 11:48:09PM | FTSE | 8249.4 | ||||||||
| 11:50:08PM | STOX50 | 4974.7 | ||||||||
| 11:53:21PM | GERMANY | 20228.5 | 20100 | 19937 | 19753 | 20332 | 20420 | 20612 | 20930 | 20240 |
| 11:56:12PM | US500 | 5819.7 | ||||||||
| 11:37:11PM | DOW | 41948.4 | ||||||||
| 11:40:07PM | NASDAQ | 20832.8 | ||||||||
| 11:42:37PM | JAPAN | 38588 |
10/01/2025 FTSE Closed at 8249 points. Change of -0.84%. Total value traded through LSE was: £ 5,170,108,064 a change of -6.19%
9/01/2025 FTSE Closed at 8319 points. Change of 11.63%. Total value traded through LSE was: £ 5,511,068,613 a change of -13.81%
8/01/2025 FTSE Closed at 7452 points. Change of -9.62%. Total value traded through LSE was: £ 6,394,228,390 a change of 16.2%
7/01/2025 FTSE Closed at 8245 points. Change of -0.05%. Total value traded through LSE was: £ 5,502,690,636 a change of 7.78%
6/01/2025 FTSE Closed at 8249 points. Change of 0.32%. Total value traded through LSE was: £ 5,105,577,084 a change of -3.75%
3/01/2025 FTSE Closed at 8223 points. Change of 0.61%. Total value traded through LSE was: £ 5,304,674,170 a change of 278.32%
31/12/2024 FTSE Closed at 8173 points. Change of 0.64%. Total value traded through LSE was: £ 1,402,162,545 a change of -42.6% 
SUCCESS above means both FAST & SLOW targets were met. ‘CESS means just the FAST target met and probably the next time it is exceeded, movement to the SLOW target shall commence.
Our commentary is in two sections. Immediately below are today’s updated comments. If our commentary remains valid, the share can be found in the bottom section which has a RED heading. Hopefully, this will mean you no longer need to flip back through previous reports. HYPERLINKS DISABLED IN THIS VERSION
Please remember, all prices are mid-price (halfway between the Buy and Sell). When we refer to a price CLOSING above a specific level, we are viewing the point where we can regard a trend as changing. Otherwise, we are simply speculating on near term trading targets. Our website is www.trendsandtargets.com.
UPDATE. We often give an initial and a secondary price. If the initial is exceeded, we still expect it to fall back but the next time the initial is bettered, the price should continue to the secondary. The converse it true with price drops.
We can be contacted at info@trendsandtargets.com. Spam filters set to maximum so only legit emails get through…
Section One – Outlook Updated Today. Click here for Section Two – Outlook Remains Valid shares
Click Epic to jump to share: LSE:GRG Greggs** **LSE:HIK Hikma** **LSE:IAG British Airways** **LSE:LLOY Lloyds Grp.** **LSE:NG. National Glib** **LSE:STAN Standard Chartered** **
********
Updated charts published on : Greggs, Hikma, British Airways, Lloyds Grp., National Glib, Standard Chartered,
LSE:GRG Greggs Close Mid-Price: 2082 Percentage Change: -5.79% Day High: 2260 Day Low: 2094
Target met. Weakness on Greggs below 2094 will invariably lead to 1977p w ……..
</p
View Previous Greggs & Big Picture ***
LSE:HIK Hikma Close Mid-Price: 2022 Percentage Change: -1.94% Day High: 2066 Day Low: 2022
Continued trades against HIK with a mid-price ABOVE 2066 should improve t ……..
</p
View Previous Hikma & Big Picture ***
LSE:IAG British Airways. Close Mid-Price: 315.9 Percentage Change: + 0.99% Day High: 316.8 Day Low: 305.6
Further movement against British Airways ABOVE 316.8 should improve acce ……..
</p
View Previous British Airways & Big Picture ***
LSE:LLOY Lloyds Grp. Close Mid-Price: 52.88 Percentage Change: -1.89% Day High: 54.1 Day Low: 52.44
Weakness on Lloyds Grp. below 52.44 will invariably lead to 51.3p with se ……..
</p
View Previous Lloyds Grp. & Big Picture ***
LSE:NG. National Glib Close Mid-Price: 918.4 Percentage Change: -1.75% Day High: 934.4 Day Low: 913.2
If National Glib experiences continued weakness below 913.2, it will inva ……..
</p
View Previous National Glib & Big Picture ***
LSE:STAN Standard Chartered. Close Mid-Price: 1025 Percentage Change: + 1.08% Day High: 1031.5 Day Low: 1002
Continued trades against STAN with a mid-price ABOVE 1031.5 should improv ……..
</p
View Previous Standard Chartered & Big Picture ***