#Stoxx50 #SP500 Unfortunately, it’s time to once again give a lesson about charts. And with this one, we’ve considerable difficulty in comprehending the logic behind it! The story kicks off with our previous review against Brent in November last year, where we provided a scenario for a drop to 72.36 dollars. This feat was successfully accomplished on December 13th, yet the rest of the dire warnings we’d provided are increasingly difficult to justify.
The problem, obviously, is twofold so we’ll give three arguments….
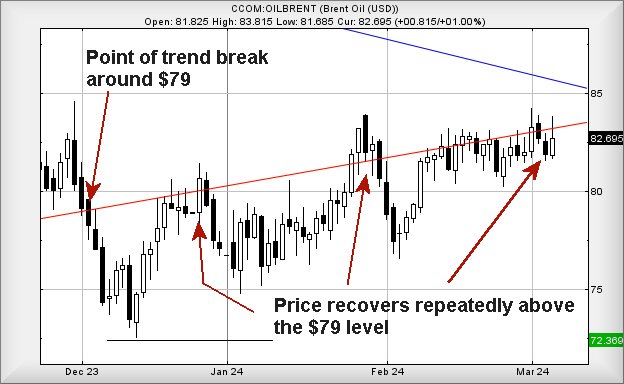
Firstly, Brent DID NOT break below our drop target. Secondly, the value of Brent managed to bounce above the level of trend break on the Red line, roughly 79 dollars. And Third is the stinker, the price of Brent Crude is carefully walking up the Red trend line.
Quite why this Third type of behaviour occurs is beyond us; we’re unable to imagine any trading mindset which would potentially promote such movement. But it is happening and also provides what can be quite a useful trading signal, due to us no longer being confident the value of the black stuff is still trading in a zone where a future $57 should provide a logical bottom. Quite the converse is the usual outcome with this series of dance steps as after all, the only sensible conclusion we should draw being that our original uptrend was wrong.
However, there’s often a grand gesture made when a price starts “walking up” a prior trend, a big thank you to those traders jealously defending short positions as they’ve been expecting a tumble for the last three months since the original trend break. Quite when it shall occur is obviously open to the ‘slings and arrows of outrageous fortune’ and in this instance, the reference from Hamlet to weapons of war is probably apt, given the state of world conflicts. It’s almost like the oil market is just waiting for the right excuse.
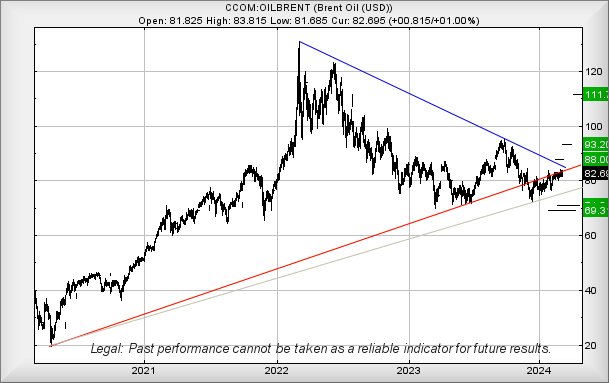
Currently trading around 82.69 US dollars, above 84.25 dollars looks capable of triggering price movement to an initial $88 with our secondary, if bettered, a perfectly sane looking $93.20. The “problem”, is such movements start to occur comes with the price of Brent moving into a cycle where we can easily imagine a third level target of $111. The funny thing, if this sort of thing takes place, it becomes possible the “Party Central” reputation of Downing St shall be eclipsed by a UK Prime Minister and Chancellor dancing in the street, due to surprise enhanced VAT revenues.
For now, we’ve no confidence remaining in the Red uptrend and suspect Brent now needs drip below $75 to provoke trouble in the fashion of reversal to an initial $71 with secondary, if broken, at $69.3 and a probable bounce.
FUTURES
| Time Issued | Market | Price At Issue | Short Entry | Fast Exit | Slow Exit | Stop | Long Entry | Fast Exit | Slow Exit | Stop | Prior |
| 9:07:56PM | BRENT | 8261.4 | |||||||||
| 9:12:51PM | GOLD | 2145.79 | ‘cess | ||||||||
| 9:22:00PM | FTSE | 7676 | Success | ||||||||
| 9:24:33PM | STOX50 | 4918 | 4883 | 4868 | 4847 | 4907 | 4931 | 4940 | 4950 | 4908 | Success |
| 10:01:17PM | GERMANY | 17717.6 | |||||||||
| 10:04:36PM | US500 | 5106.7 | 5076 | 5060 | 5038 | 5100 | 5129 | 5148 | 5179 | 5092 | Success |
| 10:07:01PM | DOW | 38672 | |||||||||
| 10:18:19PM | NASDAQ | 18016 | Success | ||||||||
| 10:21:21PM | JAPAN | 40369 | Success |
6/03/2024 FTSE Closed at 7679 points. Change of 0.43%. Total value traded through LSE was: £ 6,465,210,839 a change of 16.73%
5/03/2024 FTSE Closed at 7646 points. Change of 0.08%. Total value traded through LSE was: £ 5,538,797,167 a change of -5.01%
4/03/2024 FTSE Closed at 7640 points. Change of -0.55%. Total value traded through LSE was: £ 5,830,824,809 a change of -4.21%
1/03/2024 FTSE Closed at 7682 points. Change of 0.68%. Total value traded through LSE was: £ 6,087,264,861 a change of -41.68%
29/02/2024 FTSE Closed at 7630 points. Change of 0.08%. Total value traded through LSE was: £ 10,436,888,007 a change of 63.71%
28/02/2024 FTSE Closed at 7624 points. Change of -0.77%. Total value traded through LSE was: £ 6,375,065,167 a change of 28.06%
27/02/2024 FTSE Closed at 7683 points. Change of -0.01%. Total value traded through LSE was: £ 4,978,135,688 a change of -13% 
SUCCESS above means both FAST & SLOW targets were met. ‘CESS means just the FAST target met and probably the next time it is exceeded, movement to the SLOW target shall commence.
Our commentary is in two sections. Immediately below are today’s updated comments. If our commentary remains valid, the share can be found in the bottom section which has a RED heading. Hopefully, this will mean you no longer need to flip back through previous reports. HYPERLINKS DISABLED IN THIS VERSION
Please remember, all prices are mid-price (halfway between the Buy and Sell). When we refer to a price CLOSING above a specific level, we are viewing the point where we can regard a trend as changing. Otherwise, we are simply speculating on near term trading targets. Our website is www.trendsandtargets.com.
UPDATE. We often give an initial and a secondary price. If the initial is exceeded, we still expect it to fall back but the next time the initial is bettered, the price should continue to the secondary. The converse it true with price drops.
We can be contacted at info@trendsandtargets.com. Spam filters set to maximum so only legit emails get through…
Section One – Outlook Updated Today. Click here for Section Two – Outlook Remains Valid shares
Click Epic to jump to share: LSE:AV. Aviva** **LSE:BARC Barclays** **LSE:CCL Carnival** **LSE:GRG Greggs** **LSE:LLOY Lloyds Grp.** **LSE:NWG Natwest** **LSE:OCDO Ocado Plc** **LSE:QED Quadrise** **
********
Updated charts published on : Aviva, Barclays, Carnival, Greggs, Lloyds Grp., Natwest, Ocado Plc, Quadrise,
LSE:AV. Aviva. Close Mid-Price: 454.9 Percentage Change: + 0.82% Day High: 456.4 Day Low: 446.7
Continued trades against AV. with a mid-price ABOVE 456.4 should improve ……..
</p
View Previous Aviva & Big Picture ***
LSE:BARC Barclays. Close Mid-Price: 170.92 Percentage Change: + 0.86% Day High: 173 Day Low: 169
Continued trades against BARC with a mid-price ABOVE 173 should improve t ……..
</p
View Previous Barclays & Big Picture ***
LSE:CCL Carnival. Close Mid-Price: 1136 Percentage Change: + 1.25% Day High: 1159 Day Low: 1116
Further movement against Carnival ABOVE 1159 should improve acceleration ……..
</p
View Previous Carnival & Big Picture ***
LSE:GRG Greggs. Close Mid-Price: 2850 Percentage Change: + 2.74% Day High: 2884 Day Low: 2794
All Greggs needs are mid-price trades ABOVE 2884 to improve acceleration ……..
</p
View Previous Greggs & Big Picture ***
LSE:LLOY Lloyds Grp.. Close Mid-Price: 48.4 Percentage Change: + 1.26% Day High: 48.58 Day Low: 47.92
Target met. Continued trades against LLOY with a mid-price ABOVE 48.58 sh ……..
</p
View Previous Lloyds Grp. & Big Picture ***
LSE:NWG Natwest. Close Mid-Price: 252.4 Percentage Change: + 1.04% Day High: 255.3 Day Low: 249.9
Target met. In the event of Natwest enjoying further trades beyond 256, t ……..
</p
View Previous Natwest & Big Picture ***
LSE:OCDO Ocado Plc Close Mid-Price: 437.9 Percentage Change: -1.44% Day High: 455.1 Day Low: 431.7
If Ocado Plc experiences continued weakness below 431.7, it will invariab ……..
</p
View Previous Ocado Plc & Big Picture ***
LSE:QED Quadrise Close Mid-Price: 1.71 Percentage Change: -6.44% Day High: 1.85 Day Low: 1.7
Continued weakness against QED taking the price below 1.7 calculates as l ……..
</p
View Previous Quadrise & Big Picture ***