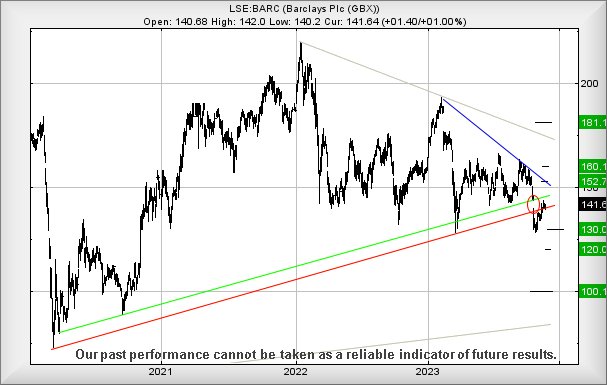
#Brent #SP500 Barclays is proving a bit greedy, even by banking standards! For the last few years, the share price has developed a; “Why bother with one uptrend, when you can have two?” It’s almost like a deliberate attempt is taking place to confuse the markets, especially as both trend lines may be thought of as equally valid. Of course, the perennial question must be, which one is the most valid?
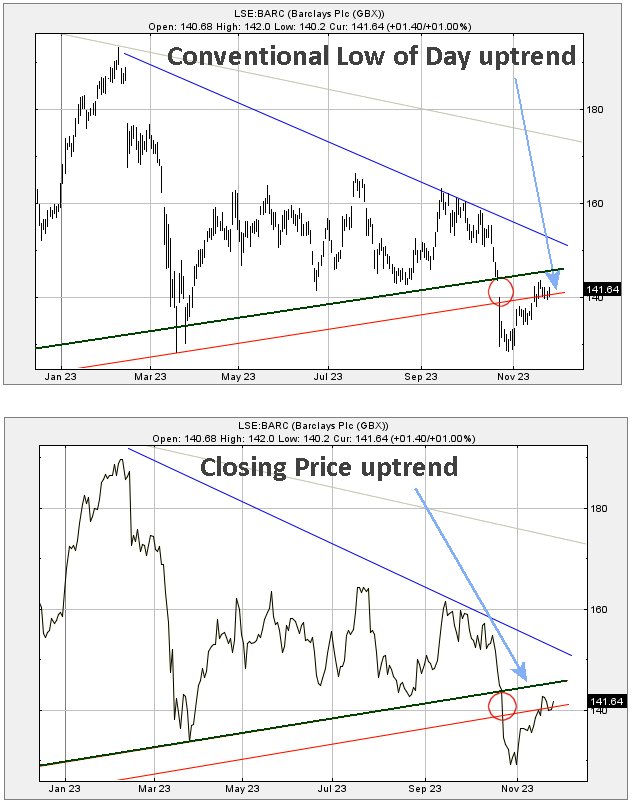
The answer, obviously, is a little bit impossible to say as despite the price breaking trend, it has yet to achieve any really convincing targets but despite this, the share price needs to close a session above just 144.6 to suggest all this trend break stuff is nonsense. The reason there are two trends which bother us is shown below.
The upper chart, the lower Red trend line represents the Low of the Day and dates back to 2020. Circled, on October 24th, in a completely random act, the market chose to manipulate the share price at the open of trade, gapping it solidly below the conventional Red uptrend. What was especially curious about this completely random act was the price also was opened below the Green Closing Price trend which also dated back to 2020. Our inclination is to embrace a suspicion the market “really” wants Barclays share price to reverse as by any standards, the manipulation at the market open on October 24th was quite emphatic. We use the term ‘manipulation’ quite unapologetically, the price movement being decided prior to any actual trades taking place. Anyone with access to market charts can easily recreate this and wonder just what the market is playing at. Our perspective is to pay more attention to the Green Closing Price uptrend as it starts to appear that’s the one the market is actually playing with.
From an immediate perspective, we are fairly cynical on what’s coming next. Below just 138p calculates with the potential of reversal to an initial 130p with our longer term secondary, if broken, working out at a future 120p, along with a vague potential for a bounce. In the event the 120p level breaks, about the best we dare hope for is a rebound before the 100p level. It is certainly quite odd, how the UK feels like it’s prepping each of the Big Three banks for some savage reversals.
However, Barclays need only close a session above 144.6p to turn our predictions into my boiled rice, or as we call it at home, mush!
Above 144.6p looks capable of triggering surprise recovery to an initial 152p with secondary, if exceeded, an eventual 160p and some potential hesitation, given share price behaviour at this level during this year.
FUTURES
| Time Issued | Market | Price At Issue | Short Entry | Fast Exit | Slow Exit | Stop | Long Entry | Fast Exit | Slow Exit | Stop |
| 8:31:58PM | BRENT | 8010.9 | 8003 | 7958 | 7877 | 8096 | 8150 | 8211 | 8280 | 8117 |
| 8:34:28PM | GOLD | 2001.78 | ||||||||
| 8:36:48PM | FTSE | 7489.5 | ||||||||
| 8:38:44PM | STOX50 | 4369.5 | ||||||||
| 9:02:26PM | GERMANY | 16023.4 | ||||||||
| 9:04:20PM | US500 | 4557 | 4552 | 4547 | 4541 | 4562 | 4565 | 4620 | 4694 | 4544 |
| 9:08:10PM | DOW | 35395 | ||||||||
| 9:11:26PM | NASDAQ | 15966.8 | ||||||||
| 9:36:25PM | JAPAN | 33668 |
24/11/2023 FTSE Closed at 7488 points. Change of 0.07%. Total value traded through LSE was: £ 4,153,667,848 a change of 5.6%
23/11/2023 FTSE Closed at 7483 points. Change of 0.19%. Total value traded through LSE was: £ 3,933,508,293 a change of -12.7%
22/11/2023 FTSE Closed at 7469 points. Change of -0.17%. Total value traded through LSE was: £ 4,505,503,688 a change of 12.22%
21/11/2023 FTSE Closed at 7482 points. Change of -0.19%. Total value traded through LSE was: £ 4,015,011,285 a change of -11.06%
20/11/2023 FTSE Closed at 7496 points. Change of -0.11%. Total value traded through LSE was: £ 4,514,299,465 a change of -13.95%
17/11/2023 FTSE Closed at 7504 points. Change of 1.27%. Total value traded through LSE was: £ 5,245,946,356 a change of -1.73%
16/11/2023 FTSE Closed at 7410 points. Change of -1.02%. Total value traded through LSE was: £ 5,338,555,524 a change of -8.11%
SUCCESS above means both FAST & SLOW targets were met. ‘CESS means just the FAST target met and probably the next time it is exceeded, movement to the SLOW target shall commence.
Our commentary is in two sections. Immediately below are today’s updated comments. If our commentary remains valid, the share can be found in the bottom section which has a RED heading. Hopefully, this will mean you no longer need to flip back through previous reports. HYPERLINKS DISABLED IN THIS VERSION
Please remember, all prices are mid-price (halfway between the Buy and Sell). When we refer to a price CLOSING above a specific level, we are viewing the point where we can regard a trend as changing. Otherwise, we are simply speculating on near term trading targets. Our website is www.trendsandtargets.com.
UPDATE. We often give an initial and a secondary price. If the initial is exceeded, we still expect it to fall back but the next time the initial is bettered, the price should continue to the secondary. The converse it true with price drops.
We can be contacted at info@trendsandtargets.com. Spam filters set to maximum so only legit emails get through…
Section One – Outlook Updated Today. Click here for Section Two – Outlook Remains Valid shares
Click Epic to jump to share: LSE:AVCT Avacta** **LSE:BARC Barclays** **LSE:BP. BP PLC** **LSE:OXIG Oxford Instruments** **LSE:TLW Tullow** **LSE:TSCO Tesco** **
********
Updated charts published on : Avacta, Barclays, BP PLC, Oxford Instruments, Tullow, Tesco,
LSE:AVCT Avacta. Close Mid-Price: 140 Percentage Change: + 8.53% Day High: 141.5 Day Low: 129
This is almost interesting as above 147 now calculates with the potential ……..
</p
View Previous Avacta & Big Picture ***
LSE:BARC Barclays. Close Mid-Price: 141.64 Percentage Change: + 1.00% Day High: 142 Day Low: 140.2
This isn’t looking great as below 138 now suggests imminent reversal down ……..
</p
View Previous Barclays & Big Picture ***
LSE:BP. BP PLC. Close Mid-Price: 476.5 Percentage Change: + 0.63% Day High: 478.35 Day Low: 470.05
This isn’t looking good, about to adhere (I think) to my GaGa theory. Belo ……..
</p
View Previous BP PLC & Big Picture ***
LSE:OXIG Oxford Instruments. Close Mid-Price: 2210 Percentage Change: + 0.91% Day High: 2215 Day Low: 2175
Now above 2215 promises a visit to an initial 2317 with secondary, if bett ……..
</p
View Previous Oxford Instruments & Big Picture ***
LSE:TLW Tullow Close Mid-Price: 38.44 Percentage Change: -0.16% Day High: 38.8 Day Low: 38.14
Continued trades against TLW with a mid-price ABOVE 38.8 should improve t ……..
</p
View Previous Tullow & Big Picture ***
LSE:TSCO Tesco. Close Mid-Price: 283.8 Percentage Change: + 1.36% Day High: 283.8 Day Low: 278.8
Further movement against Tesco ABOVE 283.8 should improve acceleration to ……..
</p
View Previous Tesco & Big Picture ***