#Gold #Japan Everyone knows the markets are about to collapse. We can read news of this, literally daily, across most of the financial media but of course, the reality is proving quite different. Markets are neither collapsing or rising at present, mainly flaffing around and doing very little, if we’re honest. Since April, Wall St has effectively described a flat line, albeit a line which is a difficult 1500 points wide.
This behaviour is especially a nuisance, due to most of the action actually taking place in the opening seconds of trade with the resultant session proving as interesting as watching a flower moving to track the sun. It’s making any concept of being glued to our monitors, watching “the action”, something difficult to justify and unfortunately, this malaise and lack of purpose feels standard across both the European and US markets. Japan, while more active, is pointless due to the difficulty in trading shares most Western brokerage accounts don’t list.
We’ve a term we often use in-house; “if it ain’t going up, check for signals it’s going down” with the contra also proving true, often.
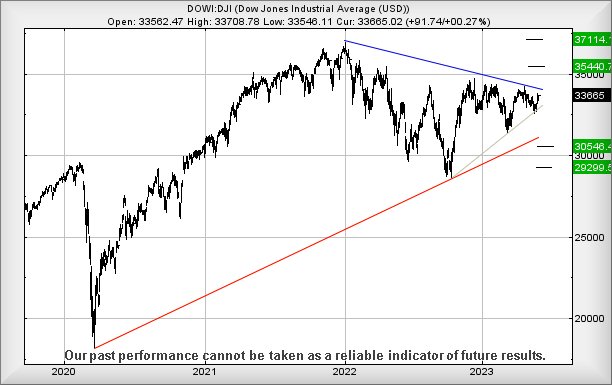
However, there’s something else which has become fairly common over the last few years, a reality where a price goes up, reaches a level, and then relaxes for a while, neither heading upward or downward with any real strength. This is the situation with which we find Wall St at present and it’s a fairly big deal. According to a few of our rules, Wall St should be heading to 35,400 points currently, rather than messing around and doing very little.
Does this mean we should advocate the potential of panic in the months ahead?
In an answer with is at odds with our trite; “if it ain’t going up” saying, we’re not convinced reversal is waiting in the wings. Instead, we suspect this US market is awaiting something it perceives as good news which shall force sharp market gains. The earliest signal for upward travel looks like above 34,000 points triggering a change in fortunes to an initial 35,440 points with secondary, if exceeded, at a longer term attraction around 37,100 and a brand new all time high for the index. In fact, from a bigger picture viewpoint, conventional logic suggests the market is supposed to be flirting with the idea of paying homage above 40,000 points eventually. Of course, none of this matches the daily rhetoric found in the financial media, where people appear to measure their contribution by the weight of negativity they provide.
Inevitably, there are risks with assuming this hiatus in an upward cycle is “just” a pause, while awaiting a positive driving force. We complain, frequently, of the harsh reality that when we review shares which are not in the “sexy” category such as found with the Nasdaq, where just 20 shares out of 500 constituents outperform sufficiently to make the entire index look incredibly healthy. Only when one drills down to mundane shares (usually household names) does a different reality become clear of unpleasant numbers of shares remaining embedded in trading levels which fail to exceed the highs achieved before the pandemic drop in 2020.
Maybe it shall prove to be the case, true growth for Wall St (and everyone else) shall only commence once a cure is discovered to assist the majority of shares “stuck” at pandemic levels. It’s already clear higher interest rates haven’t worked, higher inflation hasn’t helped, higher boardroom pay hasn’t helped. Maybe it shall be the case where less regulation (where regulation often seems to be for its own sake) shall assist in a return to times when business’s could actually drive themselves forward.
While we’re talking about the USA, it’s difficult not to remember Jeremy Clarkston and his little farm, constantly foiled in every attempt to improve his business by nonsense levels of regulation.
FUTURES
| Time Issued | Market | Price At Issue | Short Entry | Fast Exit | Slow Exit | Stop | Long Entry | Fast Exit | Slow Exit | Stop | Prior |
| 10:52:23PM | BRENT | 76.76 | ‘cess | ||||||||
| 10:55:14PM | GOLD | 1940.4 | 1939 | 1931 | 1918 | 1948 | 1954 | 1956 | 1961 | 1944 | ‘cess |
| 10:57:19PM | FTSE | 7629.05 | |||||||||
| 11:00:12PM | STOX50 | 4289.5 | |||||||||
| 11:02:33PM | GERMANY | 15948.18 | |||||||||
| 11:05:14PM | US500 | 4272.32 | |||||||||
| 11:17:20PM | DOW | 33676 | ‘cess | ||||||||
| 11:20:07PM | NASDAQ | 14316 | Success | ||||||||
| 11:22:26PM | JAPAN | 31872 | 31757 | 31533 | 31142 | 31928 | 32288 | 32338 | 32421 | 32015 | Success |
7/06/2023 FTSE Closed at 7624 points. Change of -0.05%. Total value traded through LSE was: £ 4,951,636,659 a change of 0.85%
6/06/2023 FTSE Closed at 7628 points. Change of 0.38%. Total value traded through LSE was: £ 4,909,723,355 a change of 21.93%
5/06/2023 FTSE Closed at 7599 points. Change of -0.11%. Total value traded through LSE was: £ 4,026,661,677 a change of -31.04%
2/06/2023 FTSE Closed at 7607 points. Change of 1.56%. Total value traded through LSE was: £ 5,839,256,981 a change of 14.36%
1/06/2023 FTSE Closed at 7490 points. Change of 0.59%. Total value traded through LSE was: £ 5,105,968,663 a change of -64.14%
31/05/2023 FTSE Closed at 7446 points. Change of -1.01%. Total value traded through LSE was: £ 14,237,190,282 a change of 154.29%
30/05/2023 FTSE Closed at 7522 points. Change of -100%. Total value traded through LSE was: £ 5,598,786,913 a change of 0%
SUCCESS above means both FAST & SLOW targets were met. ‘CESS means just the FAST target met and probably the next time it is exceeded, movement to the SLOW target shall commence.
Our commentary is in two sections. Immediately below are today’s updated comments. If our commentary remains valid, the share can be found in the bottom section which has a RED heading. Hopefully, this will mean you no longer need to flip back through previous reports. HYPERLINKS DISABLED IN THIS VERSION
Please remember, all prices are mid-price (halfway between the Buy and Sell). When we refer to a price CLOSING above a specific level, we are viewing the point where we can regard a trend as changing. Otherwise, we are simply speculating on near term trading targets. Our website is www.trendsandtargets.com.
UPDATE. We often give an initial and a secondary price. If the initial is exceeded, we still expect it to fall back but the next time the initial is bettered, the price should continue to the secondary. The converse it true with price drops.
We can be contacted at info@trendsandtargets.com. Spam filters set to maximum so only legit emails get through…
Section One – Outlook Updated Today. Click here for Section Two – Outlook Remains Valid shares
Click Epic to jump to share: LSE:BT.A British Telecom** **LSE:CBX Cellular Goods** **LSE:CCL Carnival** **LSE:JET Just Eat** **LSE:MKS Marks and Spencer** **LSE:QED Quadrise** **LSE:SMT Scottish Mortgage Investment Trust** **LSE:SRP Serco** **
********
Updated charts published on : British Telecom, Cellular Goods, Carnival, Just Eat, Marks and Spencer, Quadrise, Scottish Mortgage Investment Trust, Serco,
LSE:BT.A British Telecom. Close Mid-Price: 149.45 Percentage Change: + 3.75% Day High: 150.55 Day Low: 143.35
Above 158 now looks capable of triggering movement to an initial 165 with ……..
</p
View Previous British Telecom & Big Picture ***
LSE:CBX Cellular Goods Close Mid-Price: 0.88 Percentage Change: -0.57% Day High: 0.88 Day Low: 0.88
This is a bit grim as below .88 now suggests a visit to 0.58 and hopefully ……..
</p
View Previous Cellular Goods & Big Picture ***
LSE:CCL Carnival. Close Mid-Price: 910.2 Percentage Change: + 2.18% Day High: 922.4 Day Low: 882
Above 923 should still make an attempt at 961 next with secondary, if beat ……..
</p
View Previous Carnival & Big Picture ***
LSE:JET Just Eat Close Mid-Price: 1151 Percentage Change: -1.46% Day High: 1166 Day Low: 1130
In the event Just Eat experiences weakness below 1130 it calculates with a ……..
</p
View Previous Just Eat & Big Picture ***
LSE:MKS Marks and Spencer. Close Mid-Price: 189.75 Percentage Change: + 1.15% Day High: 194.95 Day Low: 188.55
Continued trades against MKS with a mid-price ABOVE 195 should improve the ……..
</p
View Previous Marks and Spencer & Big Picture ***
LSE:QED Quadrise Close Mid-Price: 1 Percentage Change: -6.88% Day High: 1.05 Day Low: 0.95
Weakness on Quadrise below 0.95 will invariably lead to 0.7 and that’s it. ……..
</p
View Previous Quadrise & Big Picture ***
LSE:SMT Scottish Mortgage Investment Trust Close Mid-Price: 696 Percentage Change: -0.57% Day High: 700.2 Day Low: 687.6
Scottish Mortgage Investment Trust needs mid-price trades ABOVE 701 to con ……..
</p
View Previous Scottish Mortgage Investment Trust & Big Picture ***
LSE:SRP Serco Close Mid-Price: 142.6 Percentage Change: -0.63% Day High: 144.8 Day Low: 140.8
If Serco experiences continued weakness below 140.8, it will invariably le ……..
</p
View Previous Serco & Big Picture ***