(NYSE:GME) #Gold #SP500 My wife, out doing the dog walk, was hailed by another dog walker who introduced herself as “The Dead Woman”. Thankfully, each immediately fell about giggling. My habit of giving folk nicknames while remembering their dogs name made recounting stories after a walk easy as no-one really walks dogs meet people. But my wife was horrified at “The Dead Woman” moniker, demanding I ‘fess up and actually swap names with her, probably the first time in history a wife demanded her husband introduce himself to a strange woman! Thus, the lady who works for a Funeral company now has a real name. It transpires everyone does similar things, my wife known as Penny WUF due to one of our dog names and three letters from her car number plate.
We’re allowed to be whimsical and today, we’re taking a look at this American share, ‘cos it was nearly 500 dollars in 2021 and presents itself with the potential for a quick lesson. A shorting campaign, leading to the inevitable useless political “awkward questions” and now, it’s trading around $24 with folk mentioning it’s a bargain. As a result, there’s no shortage of folk claiming the share price is ready to skyrocket again (it isn’t) but perhaps, we may give our brief thoughts on “the trend”. (No share is ever a bargain. Sometimes, prices stop going down, when they stop trading…)
Firstly, there’s the drop dead obvious downtrend since January 2021, a pair of market highs giving ample excuse to paint a Blue downtrend on the chart. We use Blue for downtrends, Red for uptrends, and the reason is simple, it makes a bland chart more colourful. There is no other reason.
Having drawn a downtrend, the first question which must be asked; “Is this maybe valid?”
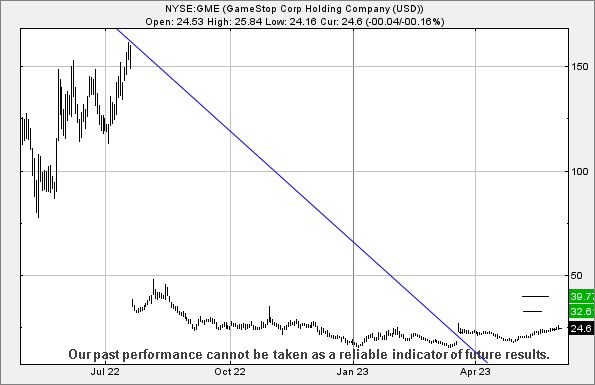
Thankfully, in the case of Gamestop, the market absolutely answered “Yes” with a movement in March of this year. As the chart below highlights, the share price was gapped above the Blue line, a fairly obvious motion which forecefully hints the downtrend may be over. Unfortunately, since the share price was barged above the Blue downtrend, not much has really happened and any promise of the share price shooting above $150 as mooted on some fanciful internet chatrooms remains, like a politicians conscience, empty.
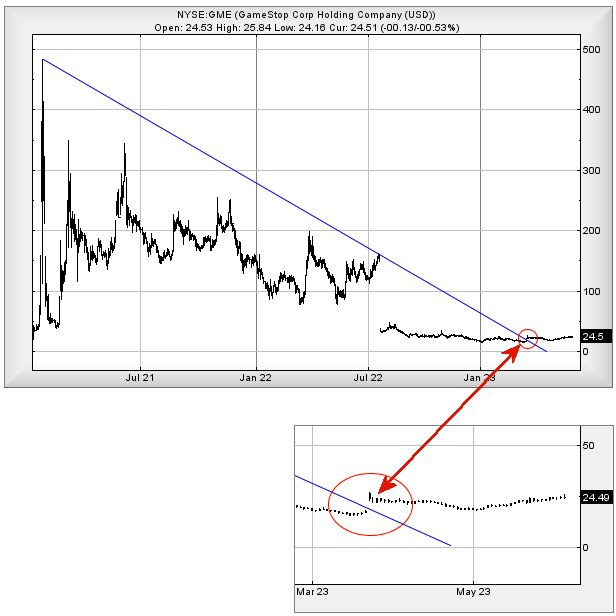
Now, if we take a look at the last two months since the trend break at 19.50 US dollars, what has really happened?
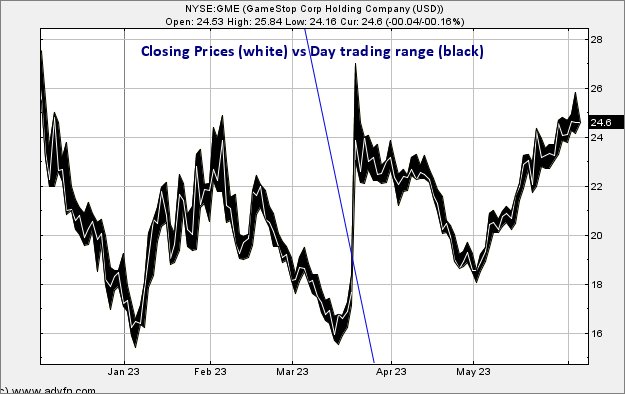
From our perspective, quite a lot, and it leaves plenty of room for some optimism in the period ahead. If we choose to focus on the share Closing Prices as they appear less likely to be the victim of internet fuelled certainty. Instead, we can see the share price is currently trading at the highest levels since the trend break. Generally, this is regarded as a good thing with the next “safe” indicator supposed to be when a share price exceeds the most recent level which defined the Blue downtrend. As this is around $159, it’s sane to suggest it isn’t going to happen anytime soon. But we still like it when a price starts to achieve ‘higher highs’ once it has broken a trend.
For Gamestop, the immediate situation suggests movement above just $26 should now make an attempt at an initial $32 with our longer term secondary, if beaten, working out at a future $39. While neither ambition comes close to the values once achieved, this particular share price needs a massive fairy with a massive wand to boost it by a $100 dollars. Or perhaps they shall issue a set of stunning earnings results but, we’d guess from price movements, the real “trend” for Gamestop was established with movements since August 2022 with any recovery of strength being applied, due to a history of hard work and solid progress. This, unfortunately, is also known as the slow path but for now, we’re optimistic about its future. Time, as always, remains the unknown constraint.
FUTURES
| Time Issued | Market | Price At Issue | Short Entry | Fast Exit | Slow Exit | Stop | Long Entry | Fast Exit | Slow Exit | Stop | Prior |
| 9:39:01PM | BRENT | 76.3 | ‘cess | ||||||||
| 9:41:20PM | GOLD | 1961.57 | 1949 | 1938 | 1923 | 1967 | 1967 | 1973 | 1985 | 1955 | ‘cess |
| 10:04:09PM | FTSE | 7594.43 | ‘cess | ||||||||
| 10:21:53PM | STOX50 | 4288 | ‘cess | ||||||||
| 10:24:13PM | GERMANY | 15951 | ‘cess | ||||||||
| 10:26:25PM | US500 | 4275.62 | 4268 | 4261 | 4248 | 4284 | 4302 | 4328 | 4361 | 4268 | |
| 10:28:12PM | DOW | 33579 | |||||||||
| 10:30:16PM | NASDAQ | 14555 | ‘cess | ||||||||
| 10:32:31PM | JAPAN | 32124 | Success |
5/06/2023 FTSE Closed at 7599 points. Change of -0.11%. Total value traded through LSE was: £ 4,026,661,677 a change of -31.04%
2/06/2023 FTSE Closed at 7607 points. Change of 1.56%. Total value traded through LSE was: £ 5,839,256,981 a change of 14.36%
1/06/2023 FTSE Closed at 7490 points. Change of 0.59%. Total value traded through LSE was: £ 5,105,968,663 a change of -64.14%
31/05/2023 FTSE Closed at 7446 points. Change of -1.01%. Total value traded through LSE was: £ 14,237,190,282 a change of 154.29%
30/05/2023 FTSE Closed at 7522 points. Change of -1.38%. Total value traded through LSE was: £ 5,598,786,913 a change of 22.18%
26/05/2023 FTSE Closed at 7627 points. Change of 0.75%. Total value traded through LSE was: £ 4,582,588,809 a change of -1.57%
25/05/2023 FTSE Closed at 7570 points. Change of -100%. Total value traded through LSE was: £ 4,655,843,667 a change of 0%
SUCCESS above means both FAST & SLOW targets were met. ‘CESS means just the FAST target met and probably the next time it is exceeded, movement to the SLOW target shall commence.
Our commentary is in two sections. Immediately below are today’s updated comments. If our commentary remains valid, the share can be found in the bottom section which has a RED heading. Hopefully, this will mean you no longer need to flip back through previous reports. HYPERLINKS DISABLED IN THIS VERSION
Please remember, all prices are mid-price (halfway between the Buy and Sell). When we refer to a price CLOSING above a specific level, we are viewing the point where we can regard a trend as changing. Otherwise, we are simply speculating on near term trading targets. Our website is www.trendsandtargets.com.
UPDATE. We often give an initial and a secondary price. If the initial is exceeded, we still expect it to fall back but the next time the initial is bettered, the price should continue to the secondary. The converse it true with price drops.
We can be contacted at info@trendsandtargets.com. Spam filters set to maximum so only legit emails get through…
Section One – Outlook Updated Today. Click here for Section Two – Outlook Remains Valid shares
Click Epic to jump to share: LSE:CCL Carnival** **LSE:DGE Diageo** **LSE:MKS Marks and Spencer** **LSE:MMAG Music Magpie** **LSE:NWG Natwest** **LSE:OCDO Ocado Plc** **LSE:ZOO Zoo Digital** **
********
Updated charts published on : Carnival, Diageo, Marks and Spencer, Music Magpie, Natwest, Ocado Plc, Zoo Digital,
LSE:CCL Carnival. Close Mid-Price: 871.8 Percentage Change: + 1.47% Day High: 871.6 Day Low: 856.2
Target met. Further movement against Carnival ABOVE 871.6 should improve ……..
</p
View Previous Carnival & Big Picture ***
LSE:DGE Diageo Close Mid-Price: 3332 Percentage Change: -1.20% Day High: 3410 Day Low: 3323
Weakness on Diageo below 3323 will invariably lead to 3288 with secondary ……..
</p
View Previous Diageo & Big Picture ***
LSE:MKS Marks and Spencer. Close Mid-Price: 187.9 Percentage Change: + 0.99% Day High: 189.7 Day Low: 186.9
Continued trades against MKS with a mid-price ABOVE 189.7 should improve ……..
</p
View Previous Marks and Spencer & Big Picture ***
LSE:MMAG Music Magpie Close Mid-Price: 15.75 Percentage Change: -4.55% Day High: 16.5 Day Low: 15.75
In the event Music Magpie experiences weakness below 15.75 it calculates ……..
</p
View Previous Music Magpie & Big Picture ***
LSE:NWG Natwest Close Mid-Price: 258.5 Percentage Change: -2.45% Day High: 266.4 Day Low: 256.9
If Natwest experiences continued weakness below 256.9, it will invariably ……..
</p
View Previous Natwest & Big Picture ***
LSE:OCDO Ocado Plc Close Mid-Price: 343.4 Percentage Change: -4.13% Day High: 364 Day Low: 342.4
Target met. If Ocado Plc experiences continued weakness below 342.4, it w ……..
</p
View Previous Ocado Plc & Big Picture ***
LSE:ZOO Zoo Digital Close Mid-Price: 117.5 Percentage Change: -3.69% Day High: 127.75 Day Low: 116.5
Weakness on Zoo Digital below 116.5 will invariably lead to 109 with seco ……..
</p
View Previous Zoo Digital & Big Picture ***