#Brent #SP500 In keeping with what’s become tradition in the retail banking sector, Barclays Plc managed to spend the last three weeks doing very little, failing to trigger any viable upward motion, failing to trigger anything seriously downward. What’s proving a little befuddling is any attempt to compare the banks price history with the history of the sector index. At first glance, the pair seem pretty similar but unfortunately, everything fell apart at the start of this year.
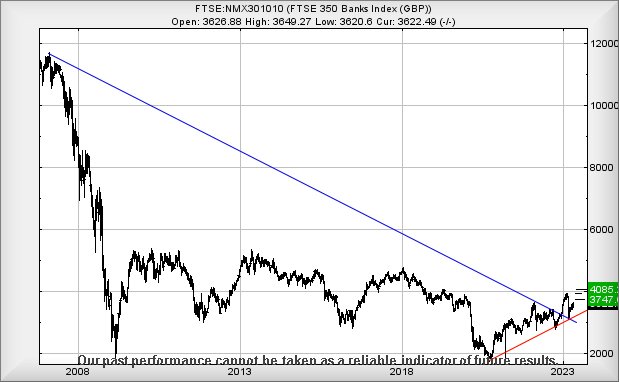
When we review the wider banking sector, we’re supposed to believe optimism should be justified. According to the sector index, the value broken through the downtrend since 2007 at the start of this year and has pretty rigidly adhered to “our rulebook” in the period since and despite a few sessions of amateur dramatics, utterly failed to close a session below the point of trend-break (3,250 points). This behaviour leads us to conclude the sector is simply awaiting an excuse to elected itself toward the 4,000 level sometime soon.
Conventional wisdom suggests Barclays should be following a similar trajectory to the sector index but this year, conventional wisdom joined political integrity as both appear to be taking a holiday somewhere far, far, away.
A quick glance at Barclays below reveals a broad similarity between the two entities until the start of this year, when something pretty important appears to have changed, hence our confusion.
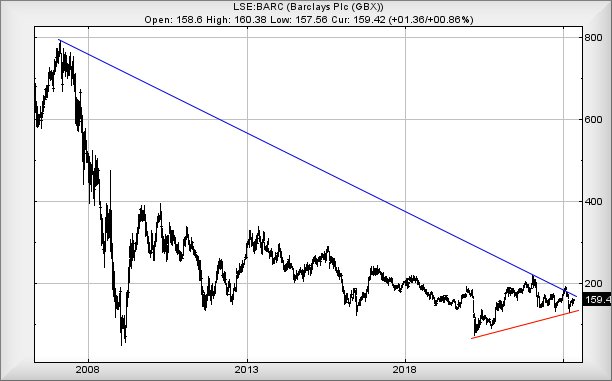
While the sector index cheerfully launched itself into 2023 with a break above the trend, Barclays followed suit yet ran out of enthusiasm by mid-February, when the market opted to manipulate (gap) the banks share price back below the historical Blue downtrend. Normally, we would expect such behaviour to promote the potential of impending reversal down to 115p eventually, something which has obviously failed to happen. The reversal logic has now changed, requiring the share price to close a session below 138p to trigger an ambition of reversal to an initial 128p with secondary, if broken, at 115p and hopefully a solid bounce.
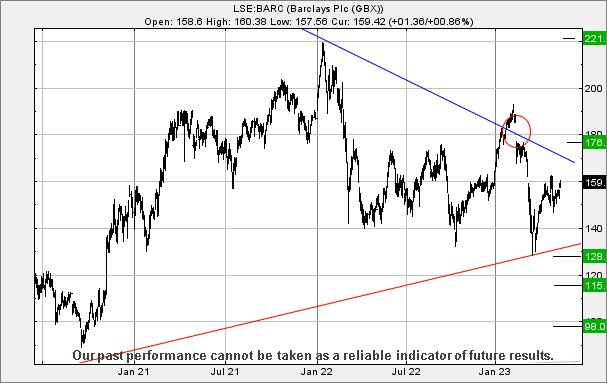
Unfortunately – or perhaps fortunately, due to the behaviour of of the sector index, we’re pretty far from comfortable predicting reversals against Barclays. Instead, we’ve a sneaking suspicion some surprise recovery may be awaiting an opportunity, the share price needing above 165p to hopefully trigger a twitch in the direction of 176p. With the share price presently trading around 159p, it certainly doesn’t need much work to hopefully kick things into life.
Our secondary, should 176p be exceeded. becomes especially interesting, calculating with the potential of triggering a surge to 221p and some probable hesitation.
What’s mildly humorous, an article over the weekend suggested investors should make an effort to select those sectors/companies which international governments will protect at all costs. Obviously, the biggest banks & mortgage houses feature, the biggest aviation companies, essentially any of the ‘too big to fail’ companies which pride themselves as being able to count on a bailout, if market conditions change unfavourably.
The only problem we experience, with the conclusion of such an article, comes from the salient detail these behemoths are now all suffering from dire share price movements, doubtless due to government bailouts taking the shine off the way the company is perceived. Even in Germany, Lufthansa €who aggressively dug themselves out from under the government, has a share price which is struggling to move above its level, pre-pandemic and, it any sort of fair world, it should be heading to 13.24€ rather than floundering around just above the 9 Euro mark.
FUTURES
| Time Issued | Market | Price At Issue | Short Entry | Fast Exit | Slow Exit | Stop | Long Entry | Fast Exit | Slow Exit | Stop |
| 9:26:26PM | BRENT | 75.64 | 75 | 74.47 | 73.5 | 75.98 | 76.65 | 77.71 | 78.34 | 75.64 |
| 10:28:54PM | GOLD | 1978.15 | 1972 | |||||||
| 10:30:17PM | FTSE | 7770.79 | 7768 | |||||||
| 10:32:26PM | STOX50 | 4397 | 4387 | |||||||
| 10:35:36PM | GERMANY | 16270.13 | 16090 | |||||||
| 10:37:20PM | US500 | 4193.77 | 4179 | 4164 | 4147 | 4198 | 4219 | 4223 | 4248 | 4180 |
| 10:39:52PM | DOW | 33423.5 | 33370 | |||||||
| 10:42:07PM | NASDAQ | 13810.32 | 13810 | |||||||
| 10:43:53PM | JAPAN | 30825 | 30848 |
19/05/2023 FTSE Closed at 7756 points. Change of 0.18%. Total value traded through LSE was: £ 5,376,481,422 a change of -9.9%
18/05/2023 FTSE Closed at 7742 points. Change of 0.25%. Total value traded through LSE was: £ 5,967,034,656 a change of 12.56%
17/05/2023 FTSE Closed at 7723 points. Change of -0.36%. Total value traded through LSE was: £ 5,301,388,137 a change of 17.83%
16/05/2023 FTSE Closed at 7751 points. Change of -0.33%. Total value traded through LSE was: £ 4,499,249,343 a change of -9.01%
15/05/2023 FTSE Closed at 7777 points. Change of 0.3%. Total value traded through LSE was: £ 4,944,763,554 a change of 10.08%
12/05/2023 FTSE Closed at 7754 points. Change of 0.31%. Total value traded through LSE was: £ 4,492,113,080 a change of -8.91%
11/05/2023 FTSE Closed at 7730 points. Change of -0.14%. Total value traded through LSE was: £ 4,931,618,860 a change of 7.65%
SUCCESS above means both FAST & SLOW targets were met. ‘CESS means just the FAST target met and probably the next time it is exceeded, movement to the SLOW target shall commence.
Our commentary is in two sections. Immediately below are today’s updated comments. If our commentary remains valid, the share can be found in the bottom section which has a RED heading. Hopefully, this will mean you no longer need to flip back through previous reports. HYPERLINKS DISABLED IN THIS VERSION
Please remember, all prices are mid-price (halfway between the Buy and Sell). When we refer to a price CLOSING above a specific level, we are viewing the point where we can regard a trend as changing. Otherwise, we are simply speculating on near term trading targets. Our website is www.trendsandtargets.com.
UPDATE. We often give an initial and a secondary price. If the initial is exceeded, we still expect it to fall back but the next time the initial is bettered, the price should continue to the secondary. The converse it true with price drops.
We can be contacted at info@trendsandtargets.com. Spam filters set to maximum so only legit emails get through…
Section One – Outlook Updated Today. Click here for Section Two – Outlook Remains Valid shares
Click Epic to jump to share: LSE:CCL Carnival** **LSE:FRES Fresnillo** **LSE:IDS International Distribution** **LSE:OCDO Ocado Plc** **LSE:PMG Parkmead** **LSE:RKH Rockhopper** **
********
Updated charts published on : Carnival, Fresnillo, International Distribution, Ocado Plc, Parkmead, Rockhopper,
LSE:CCL Carnival Close Mid-Price: 770.6 Percentage Change: -2.06% Day High: 797.2 Day Low: 772.2
Further movement against Carnival ABOVE 797.2 should improve acceleration ……..
</p
View Previous Carnival & Big Picture ***
LSE:FRES Fresnillo. Close Mid-Price: 664.8 Percentage Change: + 0.79% Day High: 667.8 Day Low: 659
If Fresnillo experiences continued weakness below 659, it will invariably ……..
</p
View Previous Fresnillo & Big Picture ***
LSE:IDS International Distribution Close Mid-Price: 204.4 Percentage Change: -2.15% Day High: 208 Day Low: 201.2
Weakness on International Distribution below 201.2 will invariably lead t ……..
</p
View Previous International Distribution & Big Picture ***
LSE:OCDO Ocado Plc Close Mid-Price: 394 Percentage Change: -0.93% Day High: 403.2 Day Low: 394
If Ocado Plc experiences continued weakness below 394, it will invariably ……..
</p
View Previous Ocado Plc & Big Picture ***
LSE:PMG Parkmead Close Mid-Price: 21 Percentage Change: -1.18% Day High: 21.25 Day Low: 20.75
Continued weakness against PMG taking the price below 20.75 calculates as ……..
</p
View Previous Parkmead & Big Picture ***
LSE:RKH Rockhopper Close Mid-Price: 14.5 Percentage Change: -2.03% Day High: 15 Day Low: 14
Continued trades against RKH with a mid-price ABOVE 15 should improve the ……..
</p
View Previous Rockhopper & Big Picture ***