#Brent #SP500 Understanding if a trend line is important can often be the most important facet of trading. After all, everyone wants’ a better clue as to the direction a price or market is heading in an attempt to escape the feeling you get, when stuck behind a BMW saloon at a junction. And why is it always saloon variants, not BMW SUV’s or estates, which don’t use indicators?
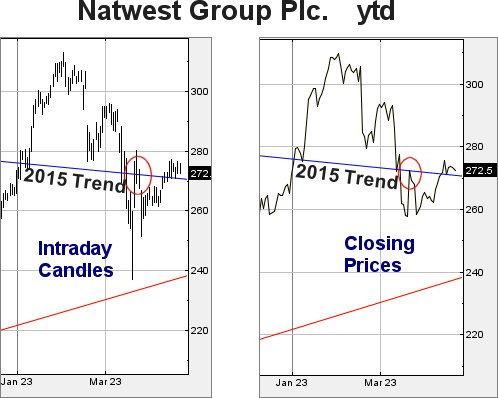
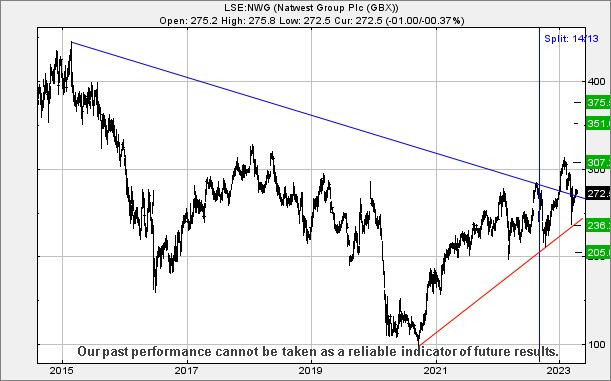
Natwest has a Blue downtrend, one which dates back to February 2015 and usually, with this years chaotic banking share movements, our inclination would be to dismiss the trend as irrelevant. However share price movements with Natwest in the last few weeks give a justifiable reason to avoid rushing into any quick decision. The two chart extracts below show, hopefully quite clearly, why we’re opting to take such a stance. Last month (March), Natwest share price tumbled below this particular trend line, rather neatly hitting out target “bottom” of 238p and bouncing a bit. The ricochet stopped and closed the next session at 272p, literally exactly at the level of this 8 year old trend. For whatever reason, the market ensured the share failed to close above the trend but on April 12th, it appears the share price gremlins had a change of heart, opting to gap the price above the historic Blue downtrend and in the sessions since, ensured the trend line remained inviolate.
It begs the pretty obvious question, does the market intend for Natwest to now gain in value, the price being carefully maintained above Blue for the most recent seven sessions?
Should this prove to be the case, we can calculate the next port in Natwest’s storm is at 307p as there are several indications the market wishes Natwest to head upward!
In the event our 307 level is exceeded, our secondary works out at 351p sometime in the future. This would prove to be an important, almost game changing, move for the share price as it’d find itself solidly above many of the highs since 2015, allowing an overdose of optimism to make itself felt.
However, we always attempt to prove a converse argument, as reminded by a clown driving a BMW i8 today. His indicators had obviously failed, everyone (including the ambulance overtaking) surprised at his sharp right turn to take the scenic route along the sea shore here in our bit of Argyll. For the market to emulate this sort of move, Natwest needs close below Blue, presently 270p, as this risks promoting a route down to 235 with secondary, if broken, at an eventual 205p and hopefully yet another bounce.
FUTURES
| Time Issued | Market | Price At Issue | Short Entry | Fast Exit | Slow Exit | Stop | Long Entry | Fast Exit | Slow Exit | Stop |
| 3:30:14AM | BRENT | 81.66 | 80.2 | 80.04 | 79.54 | 81.85 | 81.89 | 82.57 | 83.36 | 80.83 |
| 3:32:32AM | GOLD | 1983.37 | 1997 | |||||||
| 8:02:35PM | FTSE | 7911 | 7903 | |||||||
| 9:48:36PM | STOX50 | 4413.5 | 4392 | |||||||
| 9:58:20PM | GERMANY | 15889.47 | 15850 | |||||||
| 10:03:57PM | US500 | 4136.57 | 4114 | 4101 | 4076 | 4140 | 4140 | 4150 | 4162 | 4125 |
| 10:05:45PM | DOW | 33808.7 | 33784 | |||||||
| 10:32:58PM | NASDAQ | 13010 | 12972 | |||||||
| 10:35:32PM | JAPAN | 28655 | 28623 |
21/04/2023 FTSE Closed at 7914 points. Change of 0.15%. Total value traded through LSE was: £ 5,943,468,959 a change of 7%
20/04/2023 FTSE Closed at 7902 points. Change of 0.05%. Total value traded through LSE was: £ 5,554,730,029 a change of 35.28%
19/04/2023 FTSE Closed at 7898 points. Change of -0.14%. Total value traded through LSE was: £ 4,106,183,420 a change of -11.15%
18/04/2023 FTSE Closed at 7909 points. Change of 0.38%. Total value traded through LSE was: £ 4,621,350,278 a change of -3.08%
17/04/2023 FTSE Closed at 7879 points. Change of 0.1%. Total value traded through LSE was: £ 4,768,055,555 a change of -13.28%
14/04/2023 FTSE Closed at 7871 points. Change of 0.36%. Total value traded through LSE was: £ 5,498,351,712 a change of 11.26%
13/04/2023 FTSE Closed at 7843 points. Change of 0.24%. Total value traded through LSE was: £ 4,941,877,578 a change of -0.83%
SUCCESS above means both FAST & SLOW targets were met. ‘CESS means just the FAST target met and probably the next time it is exceeded, movement to the SLOW target shall commence.
Our commentary is in two sections. Immediately below are today’s updated comments. If our commentary remains valid, the share can be found in the bottom section which has a RED heading. Hopefully, this will mean you no longer need to flip back through previous reports. HYPERLINKS DISABLED IN THIS VERSION
Please remember, all prices are mid-price (halfway between the Buy and Sell). When we refer to a price CLOSING above a specific level, we are viewing the point where we can regard a trend as changing. Otherwise, we are simply speculating on near term trading targets. Our website is www.trendsandtargets.com.
UPDATE. We often give an initial and a secondary price. If the initial is exceeded, we still expect it to fall back but the next time the initial is bettered, the price should continue to the secondary. The converse it true with price drops.
We can be contacted at info@trendsandtargets.com. Spam filters set to maximum so only legit emails get through…
Section One – Outlook Updated Today. Click here for Section Two – Outlook Remains Valid shares
Click Epic to jump to share: LSE:EME Empyrean** **LSE:HIK Hikma** **LSE:HL. Hargreaves Lansdown** **LSE:IPF International Personal Finance** **LSE:NG. National Glib** **LSE:OXIG Oxford Instruments** **LSE:SMT Scottish Mortgage Investment Trust** **LSE:TSCO Tesco** **
********
Updated charts published on : Empyrean, Hikma, Hargreaves Lansdown, International Personal Finance, National Glib, Oxford Instruments, Scottish Mortgage Investment Trust, Tesco,
LSE:EME Empyrean. Close Mid-Price: 1.05 Percentage Change: + 7.57% Day High: 0.95 Day Low: 0.95
Continued weakness against EME taking the price below 0.95 calculates as ……..
</p
View Previous Empyrean & Big Picture ***
LSE:HIK Hikma Close Mid-Price: 1830.5 Percentage Change: -0.16% Day High: 1865 Day Low: 1821.5
Continued trades against HIK with a mid-price ABOVE 1865 should improve t ……..
</p
View Previous Hikma & Big Picture ***
LSE:HL. Hargreaves Lansdown. Close Mid-Price: 795 Percentage Change: + 0.10% Day High: 796.6 Day Low: 785
Continued trades against HL. with a mid-price ABOVE 845 should improve the ……..
</p
View Previous Hargreaves Lansdown & Big Picture ***
LSE:IPF International Personal Finance Close Mid-Price: 94 Percentage Change: -3.09% Day High: 94 Day Low: 92
Weakness on International Personal Finance below 92 will invariably lead ……..
</p
View Previous International Personal Finance & Big Picture ***
LSE:NG. National Glib. Close Mid-Price: 1145.5 Percentage Change: + 1.33% Day High: 1157.5 Day Low: 1129.5
Continued trades against NG. with a mid-price ABOVE 1157.5 should improve ……..
</p
View Previous National Glib & Big Picture ***
LSE:OXIG Oxford Instruments Close Mid-Price: 2715 Percentage Change: -0.37% Day High: 2805 Day Low: 2695
Target met. Further movement against Oxford Instruments ABOVE 2805 should ……..
</p
View Previous Oxford Instruments & Big Picture ***
LSE:SMT Scottish Mortgage Investment Trust. Close Mid-Price: 644.6 Percentage Change: + 0.09% Day High: 647 Day Low: 639.6
Weakness on Scottish Mortgage Investment Trust below 639.6 will invariabl ……..
</p
View Previous Scottish Mortgage Investment Trust & Big Picture ***
LSE:TSCO Tesco. Close Mid-Price: 278.9 Percentage Change: + 1.57% Day High: 278.5 Day Low: 274.3
Continued trades against TSCO with a mid-price ABOVE 278.5 should improve ……..
</p
View Previous Tesco & Big Picture ***