#Gold #SP500
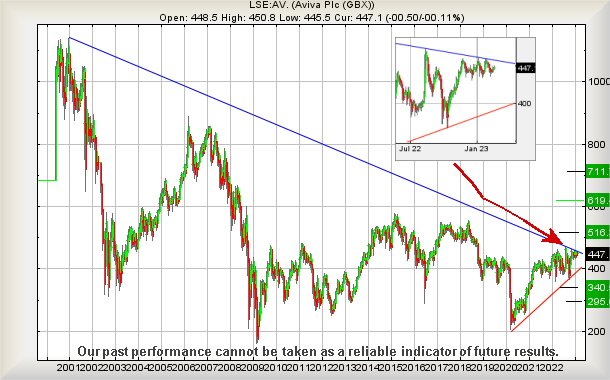
We sometimes bang on about so called “horizontal trends” and nowhere has this been shown more clearly recently than with insurer Aviva. Since August last year, the share price exhibited a pretty obvious horizontal trend around the 440p level but, to our endless amusement, no matter how many times the price exceeded the trend, nothing useful happened.
In this sort of instance, we look for other factors which may be in play, inhibiting performance, aside from the usual things to consider like wars, pandemics, inflation, politics, and a UK stock market exploring new all time highs. Surprisingly, in this instance, there appears to be a culprit which may be to blame, the Blue trend line on the chart below which dates back to December 2000! It’s quite astounding to note, if we choose to anchor the trend at this date 23 years ago, Aviva share price must currently exceed 457.209p to “prove” it’s genuinely intending to head upward.
The chart inset provided a clue to the shenanigans, a word we didn’t think resided in the autocorrect dictionary… Since August last year, there have been three share price highs, each of which confirmed the presence of such a silly sounding long term downtrend. To be honest, we would normally suspect the market would lose interest after all this time but, as Aviva claim to have been messing around in the insurance industry for over 300 years in various disguises, perhaps a 23 year old trend can be justified.
On the basis our software calculation is accurate, it’s apparently the case movement now above 457p should make an attempt at an initial 516p with secondary, if beaten, calculating at an eventual 619p. In terms of confidence levels, we’re supposed to be oozing enthusiasm as, if triggered, an eventual 619p should provide a genuine and realistic ambition. We can even toss out a third level target at 711p but given this was generated as a result of something which happened during the artificial Brexit panic of 2016, we’re not really sold on the concept.
But as for 619p, there are a few quite distinct arguments favouring such an ambition. Eventually.
FUTURES
| Time Issued | Market | Price At Issue | Short Entry | Fast Exit | Slow Exit | Stop | Long Entry | Fast Exit | Slow Exit | Stop | Prior |
| 10:50:31PM | GOLD | 1841.84 | 1836 | 1833 | 1828 | 1845 | 1848 | 1854 | 1866 | 1836 | |
| 10:52:22PM | BRENT | 83.54 | ‘cess | ||||||||
| 10:54:21PM | FTSE | 8008.16 | |||||||||
| 10:56:29PM | STOX50 | 4269.7 | |||||||||
| 10:58:38PM | GERMANY | 15471.73 | |||||||||
| 11:00:30PM | US500 | 4067.6 | 4065 | 4061 | 4054 | 4077 | 4082 | 4094 | 4110 | 4065 | |
| 11:03:56PM | DOW | 33741 | |||||||||
| 11:07:47PM | NASDAQ | 12341 | |||||||||
| 11:10:20PM | JAPAN | 27486 |
20/02/2023 FTSE Closed at 8014 points. Change of 0.12%. Total value traded through LSE was: £ 1,923,863,385 a change of -74.93%
17/02/2023 FTSE Closed at 8004 points. Change of -0.1%. Total value traded through LSE was: £ 7,672,519,841 a change of 57.8%
16/02/2023 FTSE Closed at 8012 points. Change of 0.19%. Total value traded through LSE was: £ 4,862,026,417 a change of -10.79%
15/02/2023 FTSE Closed at 7997 points. Change of 0.55%. Total value traded through LSE was: £ 5,450,342,646 a change of -0.23%
14/02/2023 FTSE Closed at 7953 points. Change of 0.08%. Total value traded through LSE was: £ 5,463,158,317 a change of 17.15%
13/02/2023 FTSE Closed at 7947 points. Change of 0.82%. Total value traded through LSE was: £ 4,663,265,889 a change of -40.31%
11/02/2023 FTSE Closed at 7882 points. Change of 0%. Total value traded through LSE was: £ 7,812,457,009 a change of 15.14%
SUCCESS above means both FAST & SLOW targets were met. ‘CESS means just the FAST target met and probably the next time it is exceeded, movement to the SLOW target shall commence.
Our commentary is in two sections. Immediately below are today’s updated comments. If our commentary remains valid, the share can be found in the bottom section which has a RED heading. Hopefully, this will mean you no longer need to flip back through previous reports. HYPERLINKS DISABLED IN THIS VERSION
Please remember, all prices are mid-price (halfway between the Buy and Sell). When we refer to a price CLOSING above a specific level, we are viewing the point where we can regard a trend as changing. Otherwise, we are simply speculating on near term trading targets. Our website is www.trendsandtargets.com.
UPDATE. We often give an initial and a secondary price. If the initial is exceeded, we still expect it to fall back but the next time the initial is bettered, the price should continue to the secondary. The converse it true with price drops.
We can be contacted at info@trendsandtargets.com. Spam filters set to maximum so only legit emails get through…
Section One – Outlook Updated Today. Click here for Section Two – Outlook Remains Valid shares
Click Epic to jump to share: LSE:CAR Carclo** **LSE:CASP Caspian** **LSE:HSBA HSBC** **LSE:NG. National Glib** **LSE:OPG OPG Power Ventures** **LSE:PMG Parkmead** **LSE:TRN The Trainline** **LSE:TSCO Tesco** **
********
Updated charts published on : Carclo, Caspian, HSBC, National Glib, OPG Power Ventures, Parkmead, The Trainline, Tesco,
LSE:CAR Carclo. Close Mid-Price: 13.78 Percentage Change: + 6.17% Day High: 14 Day Low: 13.5
Now above 14p suggests the potential of movement to an initial 15.8p with ……..
</p
View Previous Carclo & Big Picture ***
LSE:CASP Caspian. Close Mid-Price: 7.5 Percentage Change: + 5.34% Day High: 7.6 Day Low: 7.1
All Caspian needs are mid-price trades ABOVE 7.6 to improve acceleration ……..
</p
View Previous Caspian & Big Picture ***
LSE:HSBA HSBC Close Mid-Price: 620.7 Percentage Change: -0.06% Day High: 626.4 Day Low: 619.8
Further movement against HSBC ABOVE 626.4 should improve acceleration tow ……..
</p
View Previous HSBC & Big Picture ***
LSE:NG. National Glib. Close Mid-Price: 1070.5 Percentage Change: + 0.05% Day High: 1081.5 Day Low: 1062
Target met. Further movement against National Glib ABOVE 1081.5 should im ……..
</p
View Previous National Glib & Big Picture ***
LSE:OPG OPG Power Ventures. Close Mid-Price: 9 Percentage Change: + 5.26% Day High: 9.15 Day Low: 8.55
Target met. All OPG Power Ventures needs are mid-price trades ABOVE 9.15 ……..
</p
View Previous OPG Power Ventures & Big Picture ***
LSE:PMG Parkmead Close Mid-Price: 42.65 Percentage Change: -0.35% Day High: 43 Day Low: 42
In the event Parkmead experiences weakness below 42 it calculates with a ……..
</p
View Previous Parkmead & Big Picture ***
LSE:TRN The Trainline Close Mid-Price: 252 Percentage Change: -1.45% Day High: 256.7 Day Low: 251.2
In the event The Trainline experiences weakness below 251.2 it calculates ……..
</p
View Previous The Trainline & Big Picture ***
LSE:TSCO Tesco. Close Mid-Price: 251.2 Percentage Change: + 0.12% Day High: 252.1 Day Low: 250.6
Further movement against Tesco ABOVE 252.1 should improve acceleration to ……..
</p
View Previous Tesco & Big Picture ***