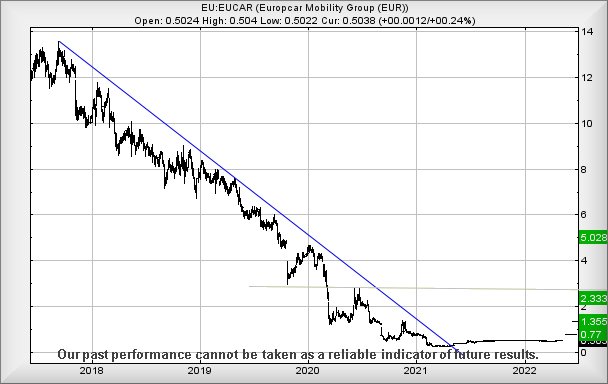
#DAX #SP500 When it comes to describing a “tough time” since the pre-pandemic high, Europcar share price chart takes some beating. Since 2017, the price has received a steady hammering, declining from the 13€ level to effectively zero, achieving a bottom at 0.25€. Everything below this ultimate 0.25€ was prefaced with an impossible minus sign.
Presently trading around 0.50€, we’re not inclined to any form of rabid celebration, the price taking a year to double from its bottom level!
However, in our trawl for anything potentially interesting in Europe, the share price now starts to look hopeful, one we suspect shall prove worth keeping an eye on. In addition, the company enjoying a recent expansion into the US, should find themselves able to become a truly worldwide organisation, this hopefully being reflected on their share price.
Currently, above just 0.53€ looks capable of triggering some price movement to an initial 0.77. Should this level be exceeded, our secondary calculation comes along at a more useful looking 1.33€ and places the share in a position of considerable hope for the longer term. It’s certainly an item which has suffered pretty nasty reversals and perhaps, it shall prove to be the case, recovery from the pandemic is not sufficient alone in properly moving the price. Instead, their acquisition of US Fox Vehicle rentals may prove the catalyst to get the price moving.
Unless, of course, they’ve bought a turkey… Visually we don’t think this shall be the case.
FUTURES
| Time Issued | Market | Price At Issue | Short Entry | Fast Exit | Slow Exit | Stop | Long Entry | Fast Exit | Slow Exit | Stop | Prior |
| 10:21:45PM | BRENT | 106.74 | Success | ||||||||
| 10:23:32PM | GOLD | 1852.7 | |||||||||
| 10:25:30PM | FTSE | 7257.34 | ‘cess | ||||||||
| 10:27:16PM | FRANCE | 6153.5 | Success | ||||||||
| 10:31:35PM | GERMANY | 13636 | 13503 | 13381 | 13215 | 13663 | 13879 | 13947 | 14171 | 13634 | |
| 10:35:22PM | US500 | 3942.75 | 3926 | 3901 | 3849 | 3968 | 4055 | 4099 | 4156 | 4002 | ‘cess |
| 10:39:16PM | DOW | 31882 | |||||||||
| 10:41:38PM | NASDAQ | 11998 | ‘cess | ||||||||
| 10:45:31PM | JAPAN | 25891 | Shambles |
11/05/2022 FTSE Closed at 7347 points. Change of 1.44%. Total value traded through LSE was: £ 9,304,334,633 a change of 45.01%
10/05/2022 FTSE Closed at 7243 points. Change of 0.37%. Total value traded through LSE was: £ 6,416,543,760 a change of 2.54%
9/05/2022 FTSE Closed at 7216 points. Change of -2.31%. Total value traded through LSE was: £ 6,257,631,157 a change of -11.88%
6/05/2022 FTSE Closed at 7387 points. Change of -1.55%. Total value traded through LSE was: £ 7,100,975,536 a change of 2.72%
5/05/2022 FTSE Closed at 7503 points. Change of 0.13%. Total value traded through LSE was: £ 6,912,828,845 a change of 20.87%
4/05/2022 FTSE Closed at 7493 points. Change of -0.9%. Total value traded through LSE was: £ 5,719,365,474 a change of -24.49%
3/05/2022 FTSE Closed at 7561 points. Change of -100%. Total value traded through LSE was: £ 7,574,559,700 a change of 0%
SUCCESS above means both FAST & SLOW targets were met. ‘CESS means just the FAST target met and probably the next time it is exceeded, movement to the SLOW target shall commence.
Our commentary is in two sections. Immediately below are today’s updated comments. If our commentary remains valid, the share can be found in the bottom section which has a RED heading. Hopefully, this will mean you no longer need to flip back through previous reports. HYPERLINKS DISABLED IN THIS VERSION
Please remember, all prices are mid-price (halfway between the Buy and Sell). When we refer to a price CLOSING above a specific level, we are viewing the point where we can regard a trend as changing. Otherwise, we are simply speculating on near term trading targets. Our website is www.trendsandtargets.com.
UPDATE. We often give an initial and a secondary price. If the initial is exceeded, we still expect it to fall back but the next time the initial is bettered, the price should continue to the secondary. The converse it true with price drops.
We can be contacted at info@trendsandtargets.com. Spam filters set to maximum so only legit emails get through…
Section One – Outlook Updated Today. Click here for Section Two – Outlook Remains Valid shares
Click Epic to jump to share: LSE:AGM Applied Graphene** **LSE:DDDD 4D Pharma** **LSE:ITRK Intertek** **LSE:ITV ITV** **LSE:JET Just Eat** **LSE:OCDO Ocado Plc** **LSE:OXIG Oxford Instruments** **LSE:RR. Rolls Royce** **LSE:SNN Sanne Plc** **LSE:SPX Spirax** **
********
Updated charts published on : Applied Graphene, 4D Pharma, Intertek, ITV, Just Eat, Ocado Plc, Oxford Instruments, Rolls Royce, Sanne Plc, Spirax,
LSE:AGM Applied Graphene Close Mid-Price: 17.5 Percentage Change: -2.78% Day High: 18 Day Low: 17
Target met. If Applied Graphene experiences continued weakness below 17, ……..
</p
View Previous Applied Graphene & Big Picture ***
LSE:DDDD 4D Pharma. Close Mid-Price: 34.85 Percentage Change: + 0.87% Day High: 35.55 Day Low: 33.55
Weakness on 4D Pharma below 33.55 will invariably lead to 29 with seconda ……..
</p
View Previous 4D Pharma & Big Picture ***
LSE:ITRK Intertek. Close Mid-Price: 4908 Percentage Change: + 0.80% Day High: 4937 Day Low: 4831
Continued weakness against ITRK taking the price below 4831 calculates as ……..
</p
View Previous Intertek & Big Picture ***
LSE:ITV ITV. Close Mid-Price: 68.62 Percentage Change: + 2.33% Day High: 69.72 Day Low: 66.9
If ITV experiences continued weakness below 66.9, it will invariably lead ……..
</p
View Previous ITV & Big Picture ***
LSE:JET Just Eat Close Mid-Price: 1521.6 Percentage Change: -0.82% Day High: 1589 Day Low: 1449.4
If Just Eat experiences continued weakness below 1449.4, it will invariab ……..
</p
View Previous Just Eat & Big Picture ***
LSE:OCDO Ocado Plc Close Mid-Price: 764.2 Percentage Change: -3.44% Day High: 793.2 Day Low: 758
Continued weakness against OCDO taking the price below 758 calculates as ……..
</p
View Previous Ocado Plc & Big Picture ***
LSE:OXIG Oxford Instruments. Close Mid-Price: 2130 Percentage Change: + 0.71% Day High: 2135 Day Low: 2080
Continued weakness against OXIG taking the price below 2080 calculates as ……..
</p
View Previous Oxford Instruments & Big Picture ***
LSE:RR. Rolls Royce. Close Mid-Price: 80.5 Percentage Change: + 2.88% Day High: 81.88 Day Low: 77.89
Weakness on Rolls Royce below 77.89 will invariably lead to 72 with secon ……..
</p
View Previous Rolls Royce & Big Picture ***
LSE:SNN Sanne Plc Close Mid-Price: 895 Percentage Change: -0.89% Day High: 905 Day Low: 893
Continued weakness against SNN taking the price below 893 calculates as l ……..
</p
View Previous Sanne Plc & Big Picture ***
LSE:SPX Spirax. Close Mid-Price: 10930 Percentage Change: + 0.78% Day High: 11105 Day Low: 10675
If Spirax experiences continued weakness below 10675, it will invariably ……..
</p
View Previous Spirax & Big Picture ***