#FTSE #Japan
It wasn’t really a surprise to discover Boris Johnston, along with other world leaders, is responsible for soaring Food and Fuel prices. Broadly speaking, Covid-19 is to blame but mismanaging the exit from the good old days of Lockdown can be laid squarely at the door of those who opted to relax pandemic restrictions. Quite literally, the price of fuel and food is entirely the fault of politicians.
As someone whose grasp of international economics stopped at Thomas Malthus and died forever under the Thatcher era, reading an essay which logically explained soaring prices caused a penny to drop, thanks to the argument making sense. Perhaps it’s the case everyone already knows this but, for now it’s easy to remain sceptical. To rehash the explanation, as the writer understood it, what has happened was foreseeable and avoidable. Except politicians pandered to a media which wanted an end to the pandemic.
Basically, the end of restrictions should have been managed, ideally with a degree of honesty into why various countries were relaxing restrictions over an extended period. Instead, the undignified rush to wave goodbye to Covid-19 over the last few months has provoked a massive international surge in demand for “stuff”. Warehouses, Storage Depots, Factories, all were sitting on massive stocks and memorably, at one point, Crude Oil achieved a minus dollar price, thanks to folk facing contracts for oil in the USA where there was literally no room left to store the product.
Times have changed.
With a massive change in demand this year, storage facilities face a situation where demand has suddenly outstripped supply. Imagine three oil refineries called Jack, Jill and Ivan. Each refinery has been plodding along for two years, easily maintaining their crude oil storage while producing product for industry. Suddenly, demand has grown 3 fold, and the refineries can envisage empty crude oil storage tanks unless something happens to improve supply. Of course, Refinery Ivan is to blame, starting the ball rolling by promising to pay a dollar premium to hijack a tanker load to divert to his facility. Refinery Jack sees this happening, immediately paying more than Ivan to get the product. In sheer panic, Refinery Jill outbids both rivals and a tanker of crude which left port with the price at 65 dollars a barrel is now heading to offload at San Francisco with the value of the load doubled. The situation continues as all refineries panic, trying to match stock levels with demand levels. After all, the only thing worse than paying through the nose for something is discovering the product is no longer available!
The (incredibly simplistic) example above relates to oil but, in real life, products from toilet paper to timber proved effected by a sudden attempt to return to normal. But it’s curious how Netflix can justify both their recent price rises… It will also be fascinating what happens, when supply and demand are again in balance. Shall we experience sharp price reductions, an economic meltdown, or will the pandemic need rear its ugly head again?
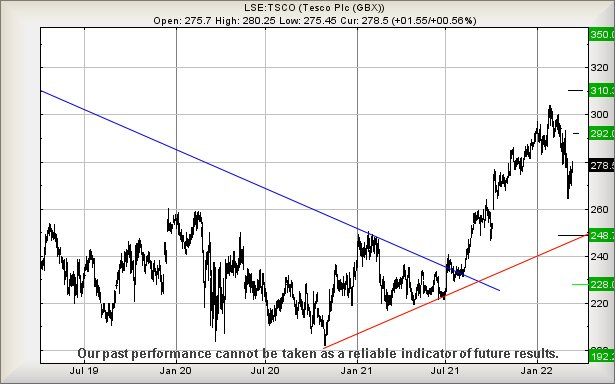
Tesco are bothering us a little. The share price managed hit both targets proposed in our report in September last year. What’s happened in the period since is proving a nuisance as despite exceeding our secondary target (291p) the share price is currently falling further than we would expect. Presently trading around 278p, the price needs below 264p to justify a frisson of worry, allowing a cycle to an initial 248 and hopeful bounce. The real problem comes, should 248p break as our secondary works out at 228p. This secondary presents a major issue, breaking below the pandemic Red uptrend and also breaking slightly below the Blue downtrend trend break level. In plain English, it allows a third level drop target down at 192p.
However, despite the gloomy potentials, our alternate scenario allows movement above 283p to apparently trigger price recovery to an initial 292p. If bettered, our longer term secondary calculates at a believable 310p.
Our thanks to the nice folks who discover a fascinating advert on this page and visit it. Keeps the coffee flowing!
FUTURES
| Time Issued | Market | Price At Issue | Short Entry | Fast Exit | Slow Exit | Stop | Long Entry | Fast Exit | Slow Exit | Stop | Prior |
| 9:52:43PM | BRENT | 97.21 | ‘cess | ||||||||
| 9:55:49PM | GOLD | 1918.11 | |||||||||
| 10:02:33PM | FTSE | 7192.27 | 7114 | 7086 | 7044 | 7150 | 7210 | 7251 | 7310 | 7151 | ‘cess |
| 10:04:37PM | FRANCE | 6389 | ‘cess | ||||||||
| 10:06:24PM | GERMANY | 13992.24 | ‘cess | ||||||||
| 10:08:29PM | US500 | 4257 | Success | ||||||||
| 10:11:18PM | DOW | 33490 | Success | ||||||||
| 10:13:46PM | NASDAQ | 13435.22 | Success | ||||||||
| 10:17:46PM | JAPAN | 25672 | 25371 | 25300 | 25164 | 25563 | 25713 | 25821 | 25928 | 25581 | Success |
15/03/2022 FTSE Closed at 7170 points. Change of -0.32%. Total value traded through LSE was: £ 6,841,972,853 a change of 11.2%
14/03/2022 FTSE Closed at 7193 points. Change of 0.53%. Total value traded through LSE was: £ 6,152,854,583 a change of -10.19%
11/03/2022 FTSE Closed at 7155 points. Change of 0.79%. Total value traded through LSE was: £ 6,850,629,560 a change of -15.87%
10/03/2022 FTSE Closed at 7099 points. Change of -1.27%. Total value traded through LSE was: £ 8,142,573,429 a change of 0.69%
9/03/2022 FTSE Closed at 7190 points. Change of 3.25%. Total value traded through LSE was: £ 8,087,014,052 a change of -12.41%
8/03/2022 FTSE Closed at 6964 points. Change of 0.07%. Total value traded through LSE was: £ 9,232,494,481 a change of -9.7%
7/03/2022 FTSE Closed at 6959 points. Change of -0.4%. Total value traded through LSE was: £ 10,224,193,154 a change of 15.38%
SUCCESS above means both FAST & SLOW targets were met. ‘CESS means just the FAST target met and probably the next time it is exceeded, movement to the SLOW target shall commence.
Our commentary is in two sections. Immediately below are today’s updated comments. If our commentary remains valid, the share can be found in the bottom section which has a RED heading. Hopefully, this will mean you no longer need to flip back through previous reports. HYPERLINKS DISABLED IN THIS VERSION
Please remember, all prices are mid-price (halfway between the Buy and Sell). When we refer to a price CLOSING above a specific level, we are viewing the point where we can regard a trend as changing. Otherwise, we are simply speculating on near term trading targets. Our website is www.trendsandtargets.com.
UPDATE. We often give an initial and a secondary price. If the initial is exceeded, we still expect it to fall back but the next time the initial is bettered, the price should continue to the secondary. The converse it true with price drops.
We can be contacted at info@trendsandtargets.com. Spam filters set to maximum so only legit emails get through…
Section One – Outlook Updated Today. Click here for Section Two – Outlook Remains Valid shares
Click Epic to jump to share: LSE:AGM Applied Graphene** **LSE:BP. BP PLC** **LSE:BT.A British Telecom** **LSE:CNA Centrica** **LSE:NG. National Glib** **LSE:ODX Omega Diags** **LSE:POLY Polymetal** **
********
Updated charts published on : Applied Graphene, BP PLC, British Telecom, Centrica, National Glib, Omega Diags, Polymetal,
LSE:AGM Applied Graphene. Close Mid-Price: 22 Percentage Change: + 4.76% Day High: 22 Day Low: 21.5
This is mildly interesting as near term above 22 expects an initial 22.6 w ……..
</p
View Previous Applied Graphene & Big Picture ***
LSE:BP. BP PLC. Close Mid-Price: 361 Percentage Change: + 1.26% Day High: 360.65 Day Low: 344.85
Despite flamboyant oil prices, BP seem to be doing their own thing. Below ……..
</p
View Previous BP PLC & Big Picture ***
LSE:BT.A British Telecom. Close Mid-Price: 177.95 Percentage Change: + 1.57% Day High: 177.8 Day Low: 173.5
In the event BT somehow start trading above 181, there is a chance somethi ……..
</p
View Previous British Telecom & Big Picture ***
LSE:CNA Centrica. Close Mid-Price: 78.42 Percentage Change: + 1.92% Day High: 78.8 Day Low: 75.96
This only needs above 79 to now suggest an initial 82 is coming. If better ……..
</p
View Previous Centrica & Big Picture ***
LSE:NG. National Glib. Close Mid-Price: 1155.4 Percentage Change: + 2.87% Day High: 1152.4 Day Low: 1105.6
In the event of National Glib enjoying further trades beyond 1152.4, the ……..
</p
View Previous National Glib & Big Picture ***
LSE:ODX Omega Diags. Close Mid-Price: 4.45 Percentage Change: + 15.58% Day High: 4.75 Day Low: 3.85
Even above 5.6 should now prove worthwhile, allowing a cycle to apparently ……..
</p
View Previous Omega Diags & Big Picture ***
LSE:POLY Polymetal Close Mid-Price: 129.8 Percentage Change: -22.90% Day High: 168.3 Day Low: 121.65
Continued weakness against POLY taking the price below 121.65 calculates ……..
</p
View Previous Polymetal & Big Picture ***