#Gold #Nasdaq
With Brent Crude hitting the $81 level, once again a bunch of folk were anticipating major oil shares to do something special. Once again, major oil shares tended not respond. It’s worth remembering when Brent Crude attempted the $130 level, BP shares dithered below the 5 quid level. The concept of a link between the price of crude and oil company shares appears illusory, mostly.
If we choose to look at Tullow, during 2013 the price of Brent Crude was pretty stable around the $120 mark. Tullow, alas, was trading initially at 1200p and now, with Brent at $81, Tullow ‘enjoy’ a share price down at just 52p. As the chart below illustrates, the last decade has not been kind to Tullow but, in fairness, there are early signs something may be changing for the better.
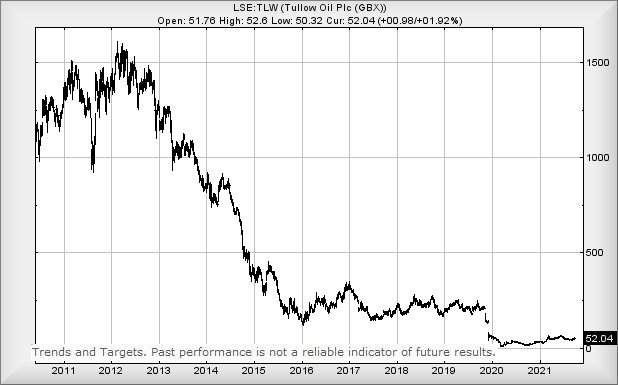
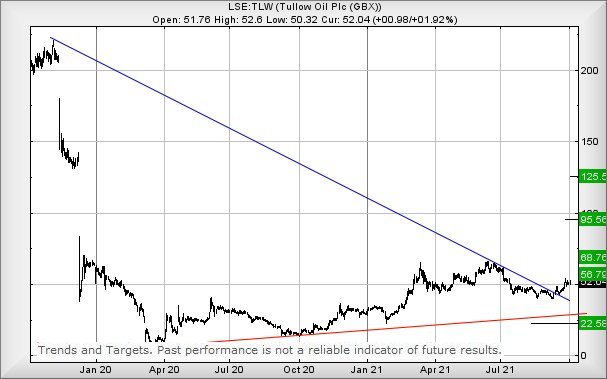
The immediate situation seems pretty straightforward with movement above 52.6 hinting at the prospect of some growth toward an initial 56.7p. While conceding this target is about as interesting as a Scottish weather forecast (always rain, obviously…) the secondary ambition gives some hope for the longer term as it’s at 68.7p. The effect of the secondary, despite any hesitation which shall probably occur should it appear, is the price will illustrate a “higher high”. This could prove quite a big deal, bettered the high prior to the break of the Blue downtrend. This has the potential for some Big Picture impetus to make itself known, calculating with a long term cycle commencing to an eventual 125p as a serious point of interest eventually.
Unfortunately, such a movement will be of little solace to the folk who convinced themselves, during the 4 years until the end of 2019, that Tullow “obviously” had a floor level around 200p, something which could be relied upon. The lesson learned was painful, essentially confirming the maxim of “If it ain’t goin’ up, it’s goin’ down…”
For the present, Tullow needs slip below 39p to cause panic. In such a scenario, we can calculate a bottom of 22p. Unfortunately, that’s also the point where we run out of numbers as every result is tainted with a minus sign thereafter.
Visiting adverts on this page “buys us a coffee”, for which we thank those who click.
FUTURES
| Time Issued | Market | Price At Issue | Short Entry | Fast Exit | Slow Exit | Stop | Long Entry | Fast Exit | Slow Exit | Stop | Prior |
| 9:54:01PM | BRENT | 80.72 | Success | ||||||||
| 9:55:55PM | GOLD | 1769.39 | 1747 | 1741 | 1731 | 1763 | 1771 | 1775 | 1779 | 1761 | Shambles |
| 10:17:57PM | FTSE | 7036.29 | |||||||||
| 10:20:53PM | FRANCE | 6493.8 | ‘cess | ||||||||
| 10:23:13PM | GERMANY | 15084.97 | ‘cess | ||||||||
| 10:25:51PM | US500 | 4304 | Success | ||||||||
| 10:29:50PM | DOW | 34016.5 | ‘cess | ||||||||
| 10:33:49PM | NASDAQ | 14497 | 14380 | 14247 | 14218 | 14509 | 14506 | 14540.5 | 14594 | 14405 | ‘cess |
| 10:37:12PM | JAPAN | 27853 | Success |
4/10/2021 FTSE Closed at 7011 points. Change of -0.23%. Total value traded through LSE was: £ 6,119,595,465 a change of -4.22%
1/10/2021 FTSE Closed at 7027 points. Change of -0.83%. Total value traded through LSE was: £ 6,388,941,462 a change of -10.36%
30/09/2021 FTSE Closed at 7086 points. Change of -0.31%. Total value traded through LSE was: £ 7,127,714,126 a change of 20.18%
29/09/2021 FTSE Closed at 7108 points. Change of 1.14%. Total value traded through LSE was: £ 5,930,956,235 a change of -17.13%
28/09/2021 FTSE Closed at 7028 points. Change of -0.5%. Total value traded through LSE was: £ 7,157,189,596 a change of 15.93%
27/09/2021 FTSE Closed at 7063 points. Change of 0.17%. Total value traded through LSE was: £ 6,173,668,955 a change of 22.77%
24/09/2021 FTSE Closed at 7051 points. Change of -0.38%. Total value traded through LSE was: £ 5,028,502,526 a change of -6.23%
SUCCESS above means both FAST & SLOW targets were met. ‘CESS means just the FAST target met and probably the next time it is exceeded, movement to the SLOW target shall commence.
Our commentary is in two sections. Immediately below are today’s updated comments. If our commentary remains valid, the share can be found in the bottom section which has a RED heading. Hopefully, this will mean you no longer need to flip back through previous reports. HYPERLINKS DISABLED IN THIS VERSION
Please remember, all prices are mid-price (halfway between the Buy and Sell). When we refer to a price CLOSING above a specific level, we are viewing the point where we can regard a trend as changing. Otherwise, we are simply speculating on near term trading targets. Our website is www.trendsandtargets.com.
UPDATE. We often give an initial and a secondary price. If the initial is exceeded, we still expect it to fall back but the next time the initial is bettered, the price should continue to the secondary. The converse it true with price drops.
We can be contacted at info@trendsandtargets.com. Spam filters set to maximum so only legit emails get through…
Section One – Outlook Updated Today. Click here for Section Two – Outlook Remains Valid shares
Click Epic to jump to share: LSE:AFC AFC Energy** **LSE:AML Aston Martin** **LSE:BP. BP PLC** **LSE:BT.A British Telecom** **LSE:CBX Cellular Goods** **LSE:CNA Centrica** **LSE:GLEN Glencore Xstra** **LSE:IAG British Airways** **LSE:ITRK Intertek** **LSE:RMG Royal Mail** **LSE:SPX Spirax** **LSE:SRP Serco** **
********
Updated charts published on : AFC Energy, Aston Martin, BP PLC, British Telecom, Cellular Goods, Centrica, Glencore Xstra, British Airways, Intertek, Royal Mail, Spirax, Serco,
LSE:AFC AFC Energy Close Mid-Price: 49.75 Percentage Change: -5.24% Day High: 52.5 Day Low: 48.75
Weakness on AFC Energy below 48.75 will invariably lead to 46 with second ……..
</p
View Previous AFC Energy & Big Picture ***
LSE:AML Aston Martin Close Mid-Price: 1783.5 Percentage Change: -2.51% Day High: 1841 Day Low: 1784.5
Target met. If Aston Martin experiences continued weakness below 1784.5, ……..
</p
View Previous Aston Martin & Big Picture ***
LSE:BP. BP PLC. Close Mid-Price: 344.45 Percentage Change: + 1.92% Day High: 347.75 Day Low: 337.3
Further movement against BP PLC ABOVE 347.75 should improve acceleration ……..
</p
View Previous BP PLC & Big Picture ***
LSE:BT.A British Telecom Close Mid-Price: 151.45 Percentage Change: -4.66% Day High: 153 Day Low: 146.35
Target met. If British Telecom experiences continued weakness below 146.3 ……..
</p
View Previous British Telecom & Big Picture ***
LSE:CBX Cellular Goods. Close Mid-Price: 7.9 Percentage Change: + 12.86% Day High: 8.38 Day Low: 7.3
In the event of Cellular Goods enjoying further trades beyond 8.4, the sh ……..
</p
View Previous Cellular Goods & Big Picture ***
LSE:CNA Centrica. Close Mid-Price: 58.34 Percentage Change: + 1.07% Day High: 58.56 Day Low: 57.56
Target met. Further movement against Centrica ABOVE 58.56 should improve ……..
</p
View Previous Centrica & Big Picture ***
LSE:GLEN Glencore Xstra. Close Mid-Price: 355 Percentage Change: + 1.23% Day High: 360.65 Day Low: 349.8
Continued trades against GLEN with a mid-price ABOVE 360.65 should improv ……..
</p
View Previous Glencore Xstra & Big Picture ***
LSE:IAG British Airways Close Mid-Price: 187.9 Percentage Change: -0.06% Day High: 193.7 Day Low: 186.74
Target met. All British Airways needs are mid-price trades ABOVE 193.7 t ……..
</p
View Previous British Airways & Big Picture ***
LSE:ITRK Intertek Close Mid-Price: 4795 Percentage Change: -1.48% Day High: 4903 Day Low: 4796
Target met. If Intertek experiences continued weakness below 4796, it wil ……..
</p
View Previous Intertek & Big Picture ***
LSE:RMG Royal Mail Close Mid-Price: 407 Percentage Change: -2.30% Day High: 416.3 Day Low: 407.1
If Royal Mail experiences continued weakness below 407.1, it will invaria ……..
</p
View Previous Royal Mail & Big Picture ***
LSE:SPX Spirax Close Mid-Price: 14575 Percentage Change: -1.29% Day High: 14865 Day Low: 14530
Target met. In the event Spirax experiences weakness below 14530 it calcu ……..
</p
View Previous Spirax & Big Picture ***
LSE:SRP Serco Close Mid-Price: 130.6 Percentage Change: -1.36% Day High: 133.1 Day Low: 130
If Serco experiences continued weakness below 130, it will invariably lea ……..
</p
View Previous Serco & Big Picture ***