#Gold #SP500 Sometimes, there is a strange type of fatalistic attitude on the markets. An immediate example of this type of thinking relates to the S&P 500, the complaint being fairly straightforward; ‘It’s going up!’. Doubtless, the fact the index closed just 0.73 below its prior high will now also be used as an excuse to manufacture fear in the marketplace. Just as there’s no rule which inhibits a price from falling below a certain level, equally there’s no rule dictating how high a price may go.
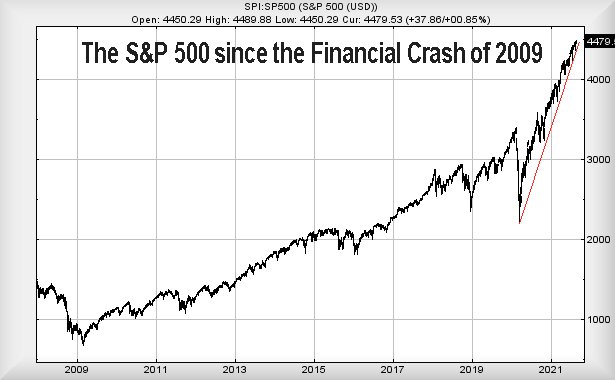
One of our favourite ‘Red Flag’ statements relating to share prices is the classic, “the share price is absurdly cheap at such a level.” Unfortunately, folk who believe the integrity of such generally find themselves walking funny, upon discovering their 100p share can quite cheerfully slip lower. However, sometimes trite analysis can have a pretty firm basis in logic. Apparently, the S&P has now experienced 201 sessions without experiencing a reversal of more than 5% and the argument is being made we should expect one.
At first glance, the chart below allows the pretence this could be right. We should all be looking nervously over our shoulders but there is another reality. The previous longest stretch without a pullback of above 5% occurred in early 2018, when 404 sessions of growth elapsed before it all went a little bit wrong. Just because the index is currently at 201 sessions shouldn’t make people nervous. But what makes us nervous has been the pace of climb since the Covid-19 crash in 2020. This US index has more than doubled in value since the pandemic low. Often, a relentless climb such as this risks being wiped off the map in just a few sessions. This isn’t always true, Tesla Motor being a case in point but equally, crypto currency tends repay sharp rises with remorseless falls.
Our preferred attitude is to provide a reversal logic which is fairly tame, hopefully able to provide early warning of stormy times ahead should our drop targets start being broken.
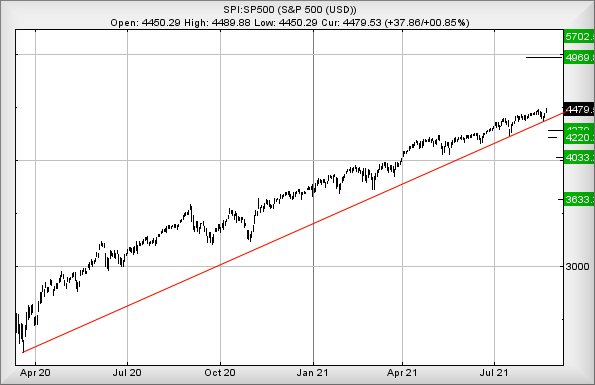
In the case of the S&P, below 4397 looks problematic, allowing reversal to an initial 4279. If broken, our secondary works out at 4220 points, a level where the visuals give some hope for a bounce. In fairness, this would also virtually match the 5% reversal expectation too. Keeping with our habit of examining how bad things can really get, should the index close a session below 4220 points, a pretty severe reversal path down to 3633 eventually becomes arithmetically possible.
Earlier, we said there is never a certainty of a ceiling or floor in the marketplace.
There’s a pretty cloudy argument making it extremely difficult to plot future upward potentials for the S&P. However, should the index next manage to trade above 4490 points, we can currently provide a scenario where continued gains toward 4597 are expected with a seriously longer term influence exerted at an amazing 4969 points! Normally, we’d have trouble accepting such lofty ambitions but since the pandemic hit, ‘normality’ has become a concept the markets no longer understand, if they ever did!
Trends and Targets. Past performance is not a reliable indicator of future results..
A huge thanks to the folk who found adverts here interesting on Monday. Our error with Eurasia almost seemed to turn the page into clickbait, making nonsense headlines understandable. (Not our style…)
FUTURES
| Time Issued | Market | Price At Issue | Short Entry | Fast Exit | Slow Exit | Stop | Long Entry | Fast Exit | Slow Exit | Stop | Prior |
| 10:31:44PM | BRENT | 68.36 | Success | ||||||||
| 10:33:56PM | GOLD | 1805.7 | 1784 | 1782 | 1774 | 1792 | 1806 | 1818 | 1826 | 1790 | Success |
| 10:37:57PM | FTSE | 7120.54 | Shambles | ||||||||
| 10:40:25PM | FRANCE | 6685.7 | Success | ||||||||
| 10:43:40PM | GERMANY | 15865 | Hmmm | ||||||||
| 10:51:08PM | US500 | 4486.22 | 4442 | 4426 | 4405 | 4470 | 4489 | 4492 | 4538 | 4442 | Success |
| 10:53:56PM | DOW | 35384.5 | Success | ||||||||
| 10:56:44PM | NASDAQ | 15333.72 | Success | ||||||||
| 10:59:41PM | JAPAN | 27597 | ‘cess |
23/08/2021 FTSE Closed at 7109 points. Change of 0.31%. Total value traded through LSE was: £ 4,335,174,689 a change of -8.49%
20/08/2021 FTSE Closed at 7087 points. Change of 0.41%. Total value traded through LSE was: £ 4,737,378,456 a change of -4.32%
19/08/2021 FTSE Closed at 7058 points. Change of -1.55%. Total value traded through LSE was: £ 4,951,507,181 a change of -2.94%
18/08/2021 FTSE Closed at 7169 points. Change of -0.17%. Total value traded through LSE was: £ 5,101,308,767 a change of 1.33%
17/08/2021 FTSE Closed at 7181 points. Change of 0.39%. Total value traded through LSE was: £ 5,034,493,544 a change of 2.47%
16/08/2021 FTSE Closed at 7153 points. Change of -0.9%. Total value traded through LSE was: £ 4,913,032,412 a change of 23.5%
13/08/2021 FTSE Closed at 7218 points. Change of 0.35%. Total value traded through LSE was: £ 3,978,009,773 a change of -26.52%
SUCCESS above means both FAST & SLOW targets were met. ‘CESS means just the FAST target met and probably the next time it is exceeded, movement to the SLOW target shall commence.
Our commentary is in two sections. Immediately below are today’s updated comments. If our commentary remains valid, the share can be found in the bottom section which has a RED heading. Hopefully, this will mean you no longer need to flip back through previous reports. HYPERLINKS DISABLED IN THIS VERSION
Please remember, all prices are mid-price (halfway between the Buy and Sell). When we refer to a price CLOSING above a specific level, we are viewing the point where we can regard a trend as changing. Otherwise, we are simply speculating on near term trading targets. Our website is www.trendsandtargets.com.
UPDATE. We often give an initial and a secondary price. If the initial is exceeded, we still expect it to fall back but the next time the initial is bettered, the price should continue to the secondary. The converse it true with price drops.
We can be contacted at info@trendsandtargets.com. Spam filters set to maximum so only legit emails get through…
Section One – Outlook Updated Today. Click here for Section Two – Outlook Remains Valid shares
Click Epic to jump to share: LSE:BBY BALFOUR BEATTY** **LSE:BDEV Barrett Devs** **LSE:BT.A British Telecom** **LSE:EME Empyrean** **LSE:IGG IG Group** **LSE:MKS Marks and Spencer** **LSE:ODX Omega Diags** **LSE:RR. Rolls Royce** **LSE:SBRY Sainsbury** **LSE:SPX Spirax** **LSE:SRP Serco** **LSE:TSCO Tesco** **
********
Updated charts published on : BALFOUR BEATTY, Barrett Devs, British Telecom, Empyrean, IG Group, Marks and Spencer, Omega Diags, Rolls Royce, Sainsbury, Spirax, Serco, Tesco,
LSE:BBY BALFOUR BEATTY Close Mid-Price: 283 Percentage Change: -2.28% Day High: 296.4 Day Low: 281.8
Weakness on BALFOUR BEATTY below 281.8 will invariably lead to 280 with s ……..
</p
View Previous BALFOUR BEATTY & Big Picture ***
LSE:BDEV Barrett Devs Close Mid-Price: 709.8 Percentage Change: -0.76% Day High: 726.6 Day Low: 707.6
All Barrett Devs needs are mid-price trades ABOVE 726.6 to improve accele ……..
</p
View Previous Barrett Devs & Big Picture ***
LSE:BT.A British Telecom Close Mid-Price: 168.15 Percentage Change: -3.03% Day High: 174.45 Day Low: 166.15
Weakness on British Telecom below 166.15 will invariably lead to 160 with ……..
</p
View Previous British Telecom & Big Picture ***
LSE:EME Empyrean. Close Mid-Price: 5.85 Percentage Change: + 1.74% Day High: 5.85 Day Low: 5.75
This is messing around in quite an alarming fashion. Weakness now below 5. ……..
</p
View Previous Empyrean & Big Picture ***
LSE:IGG IG Group Close Mid-Price: 932 Percentage Change: -0.48% Day High: 945 Day Low: 931
All IG Group needs are mid-price trades ABOVE 945 to improve acceleration ……..
</p
View Previous IG Group & Big Picture ***
LSE:MKS Marks and Spencer. Close Mid-Price: 163.9 Percentage Change: + 0.68% Day High: 167.65 Day Low: 164.2
Continued trades against MKS with a mid-price ABOVE 167.65 should improve ……..
</p
View Previous Marks and Spencer & Big Picture ***
LSE:ODX Omega Diags. Close Mid-Price: 49.5 Percentage Change: + 17.86% Day High: 49.5 Day Low: 40.5
Further movement against Omega Diags ABOVE 52 should improve acceleration ……..
</p
View Previous Omega Diags & Big Picture ***
LSE:RR. Rolls Royce. Close Mid-Price: 113.74 Percentage Change: + 3.25% Day High: 114.3 Day Low: 111.1
Further movement against Rolls Royce ABOVE 114.3 should improve accelerat ……..
</p
View Previous Rolls Royce & Big Picture ***
LSE:SBRY Sainsbury. Close Mid-Price: 340 Percentage Change: + 15.37% Day High: 341.2 Day Low: 302
Target met. Should Sainsbury enjoy further trades beyond 343, the share sh ……..
</p
View Previous Sainsbury & Big Picture ***
LSE:SPX Spirax. Close Mid-Price: 16045 Percentage Change: + 0.53% Day High: 16125 Day Low: 15920
Target met. All Spirax needs are mid-price trades ABOVE 16125 to improve ……..
</p
View Previous Spirax & Big Picture ***
LSE:SRP Serco Close Mid-Price: 134.8 Percentage Change: -1.39% Day High: 137.5 Day Low: 134.6
In the event Serco experiences weakness below 134.6 it calculates with a ……..
</p
View Previous Serco & Big Picture ***
LSE:TSCO Tesco. Close Mid-Price: 251.5 Percentage Change: + 2.03% Day High: 252.8 Day Low: 247.75
Target met. All Tesco needs are mid-price trades ABOVE 253 to improve acc ……..
</p
View Previous Tesco & Big Picture ***