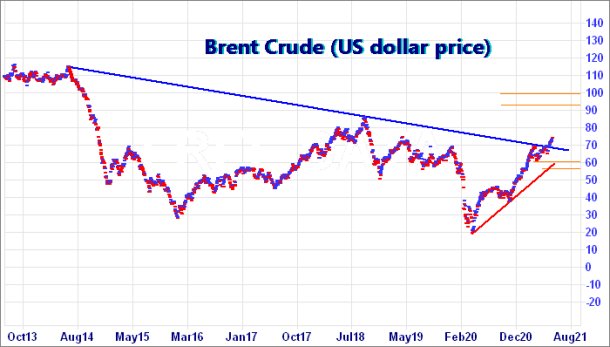
#FTSE & #BrentCrude We’re worried about Brent Crude! Not because it may go up or down but because of our historical reputation with the stuff. Our track record of getting it right, when it comes to Big Picture movements for crude oil is causing immediate concern. The price of Brent now flapping around in a zone where it risks triggering a pretty major price cycle and if it does so, it shall also trigger daily nerves at our end.
The first “issue” comes from the immediate price. The commodity is trading above the pre-pandemic level of 60 dollars. This provides the first trip into the realm of confidence.
The second “issue” is provided by the Blue line on the chart. This very obvious downtrend has now been exceeded, another reason for hope for the future.
The third “issue” is the previous high of 70 dollars, a price level which confirmed the Blue downtrend. As this has now been bettered, Brent Crude is now living in the land of Higher Highs, conventionally the place where optimism resides.
And finally, there’s our immediate target level just above the 75 dollar mark. This was calculated using price movements from this year, hardly a big picture thing. Should Brent Crude now exceed 75.50, the price enters the realm of Big Picture calculations. As a result, we shall be forced to promote the concept of further price miracles in the direction of 93 dollars initially with secondary, if exceeded, working out at 100 dollars.
If it all intends go wrong for Brent, the price needs drip below 68 dollars as this risks triggering an initial $60 with secondary, if broken, at $54. At present, the oil price is twitching around, just below our 75 dollar level, displaying the hesitation we refer to as “stutters” prior to a future demonstration of direction.
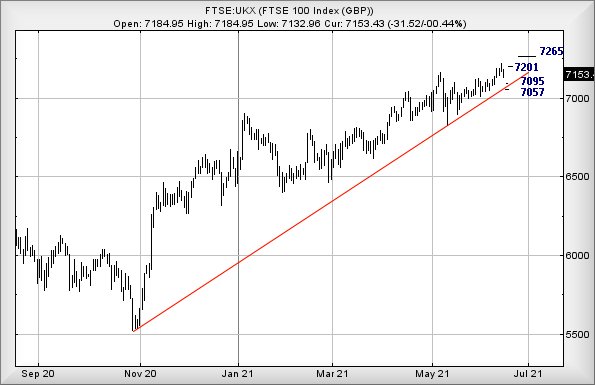
FTSE for FRIDAY Usually, the market sidles toward the weekend, giving a bit of a clue as to market direction in the near term. For Friday, we can agree on one thing; we’re utterly clueless as to market intentions! On Thursday, the index dropped (a bit), successfully hitting our initial target, even breaking it for a few minutes. But as all the days action took place in the opening second of trade, it was all very artificial, leaving nothing in its wake except confusion. From our perspective, Thursday was an utter waste of time, especially as the market itself didn’t feel like it knew what to do with itself.
The conclusion drawn from the exercise suggests the FTSE actually now needs below 7125 before any reversal dare be taken seriously. Such a movement feels like it could now trigger reversal to an initial 7095 points with secondary, if broken, calculating at 7057 points.
However, we still maintain the hope the FTSE shall join other major index’ by trading above its pre-pandemic high of 7550. This results in the (perhaps naive) hope the index enjoys underlying force driving it upward. If this indeed is the case, above 7175 points suggests the potential of near term movement to an initial 7201 points. If bettered, our secondary works out at 7265 points.
It may also be worth remembering the lesson from Thursday. If all the action occurs in the first second of trade, why not go do something else as the day is liable to be another waste of time. There’s always some grass needing cut…
FUTURES
| Time Issued | Market | Price At Issue | Short Entry | Fast Exit | Slow Exit | Stop | Long Entry | Fast Exit | Slow Exit | Stop | Prior |
| 11:02:56PM | BRENT | 72.53 | 71.96 | 71.4 | 72.9 | 72.9 | 73.335 | 72.43 | ‘cess | ||
| 11:05:46PM | GOLD | 1775.86 | 1767 | 1760 | 1792 | 1792 | 1803 | 1772 | Success | ||
| 11:07:43PM | FTSE | 7162 | 7126 | 7098 | 7170 | 7172 | 7187.5 | 7137 | Shambles | ||
| 11:22:30PM | FRANCE | 6670 | 6639 | 6627.5 | 6670 | 6671 | 6681 | 6659 | ‘cess | ||
| 11:25:01PM | GERMANY | 15746 | 15630 | 15600 | 15737 | 15756 | 15811.5 | 15678 | |||
| 11:27:20PM | US500 | 4225.87 | 4216 | 4206 | 4233 | 4237 | 4249 | 4210 | ‘cess | ||
| 11:30:09PM | DOW | 33836 | 33748 | 33644 | 33898 | 34084 | 34117.5 | 33856 | Success | ||
| 11:32:21PM | NASDAQ | 14193 | 13870 | 13729.5 | 13952 | 14208 | 14242 | 14102 | |||
| 11:33:52PM | JAPAN | 29197 | 28850 | No idea | 29204 | 29363 | 29060 | Success |
17/06/2021 FTSE Closed at 7153 points. Change of -0.43%. Total value traded through LSE was: £ 5,772,023,987 a change of -2.72%
16/06/2021 FTSE Closed at 7184 points. Change of 0.17%. Total value traded through LSE was: £ 5,933,708,307 a change of 0.36%
15/06/2021 FTSE Closed at 7172 points. Change of 0.36%. Total value traded through LSE was: £ 5,912,147,960 a change of 2.11%
14/06/2021 FTSE Closed at 7146 points. Change of 0.17%. Total value traded through LSE was: £ 5,789,732,909 a change of 12.95%
11/06/2021 FTSE Closed at 7134 points. Change of 0.65%. Total value traded through LSE was: £ 5,126,105,822 a change of 3.18%
10/06/2021 FTSE Closed at 7088 points. Change of 0.1%. Total value traded through LSE was: £ 4,968,352,767 a change of 1.13%
9/06/2021 FTSE Closed at 7081 points. Change of -0.2%. Total value traded through LSE was: £ 4,913,059,029 a change of 3.4%
SUCCESS above means both FAST & SLOW targets were met. ‘CESS means just the FAST target met and probably the next time it is exceeded, movement to the SLOW target shall commence.
Our commentary is in two sections. Immediately below are today’s updated comments. If our commentary remains valid, the share can be found in the bottom section which has a RED heading. Hopefully, this will mean you no longer need to flip back through previous reports. HYPERLINKS DISABLED IN THIS VERSION
Please remember, all prices are mid-price (halfway between the Buy and Sell). When we refer to a price CLOSING above a specific level, we are viewing the point where we can regard a trend as changing. Otherwise, we are simply speculating on near term trading targets. Our website is www.trendsandtargets.com.
UPDATE. We often give an initial and a secondary price. If the initial is exceeded, we still expect it to fall back but the next time the initial is bettered, the price should continue to the secondary. The converse it true with price drops.
We can be contacted at info@trendsandtargets.com. Spam filters set to maximum so only legit emails get through…
Section One – Outlook Updated Today. Click here for Section Two – Outlook Remains Valid shares
Click Epic to jump to share: LSE:BDEV Barrett Devs** **LSE:BT.A British Telecom** **LSE:CAR Carclo** **LSE:EMG MAN** **LSE:EXPN Experian** **LSE:IQE IQE** **LSE:MRW Morrisons** **LSE:ODX Omega Diags** **LSE:OPG OPG Power Ventures** **LSE:RR. Rolls Royce** **
********
Updated charts published on : Barrett Devs, British Telecom, Carclo, MAN, Experian, IQE, Morrisons, Omega Diags, OPG Power Ventures, Rolls Royce,
LSE:BDEV Barrett Devs Close Mid-Price: 724.8 Percentage Change: -1.23% Day High: 733.4 Day Low: 715.8
If Barrett Devs experiences continued weakness below 715.8, it will invar ……..
</p
View Previous Barrett Devs & Big Picture ***
LSE:BT.A British Telecom. Close Mid-Price: 205.6 Percentage Change: + 2.70% Day High: 206.5 Day Low: 198.4
Continued trades against BT.A with a mid-price ABOVE 206.5 should improve ……..
</p
View Previous British Telecom & Big Picture ***
LSE:CAR Carclo Close Mid-Price: 51.9 Percentage Change: -3.89% Day High: 53 Day Low: 50
If Carclo experiences continued weakness below 50, it will invariably lea ……..
</p
View Previous Carclo & Big Picture ***
LSE:EMG MAN. Close Mid-Price: 190.2 Percentage Change: + 0.00% Day High: 191.95 Day Low: 188.8
In the event of MAN enjoying further trades beyond 191.95, the share shou ……..
</p
View Previous MAN & Big Picture ***
LSE:EXPN Experian. Close Mid-Price: 2785 Percentage Change: + 0.54% Day High: 2782 Day Low: 2717
All Experian needs are mid-price trades ABOVE 2782 to improve acceleratio ……..
</p
View Previous Experian & Big Picture ***
LSE:IQE IQE. Close Mid-Price: 50.9 Percentage Change: + 2.62% Day High: 51 Day Low: 48.25
This has spent a month, failing to go down, failing to go up. It shall be ……..
</p
View Previous IQE & Big Picture ***
LSE:MRW Morrisons. Close Mid-Price: 181.7 Percentage Change: + 2.89% Day High: 182.7 Day Low: 179.3
This presents an immediate case study in my GaGa theory for gap manipulati ……..
</p
View Previous Morrisons & Big Picture ***
LSE:ODX Omega Diags Close Mid-Price: 60.5 Percentage Change: -0.82% Day High: 65 Day Low: 57.75
Continued weakness against ODX taking the price below 57.75 calculates as ……..
</p
View Previous Omega Diags & Big Picture ***
LSE:OPG OPG Power Ventures. Close Mid-Price: 14.75 Percentage Change: + 0.00% Day High: 14.75 Day Low: 14.25
Target met. If OPG Power Ventures experiences continued weakness below 14 ……..
</p
View Previous OPG Power Ventures & Big Picture ***
LSE:RR. Rolls Royce. Close Mid-Price: 111.92 Percentage Change: + 1.75% Day High: 113.42 Day Low: 109.12
All Rolls Royce needs are mid-price trades ABOVE 114 to improve accelerati ……..
</p
View Previous Rolls Royce & Big Picture ***