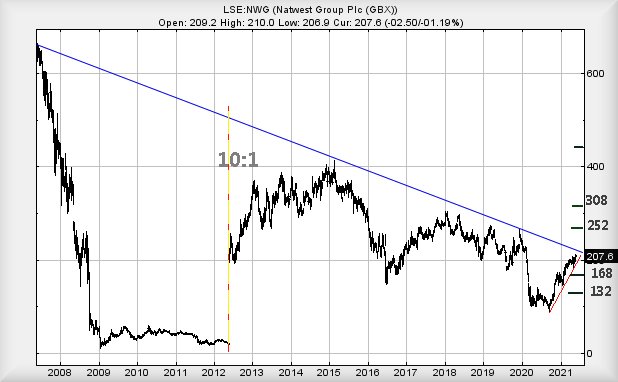
#Brent #CAC40 Since May 2007, Natwest has allegedly had a downtrend, one we’re showing in Blue on the chart. Unfortunately, the integrity of this Blue line is in considerable doubt, due to the share price experiencing a 10:1 consolidation in 2012, changing their name from Royal Bank, and companies managing to utterly confuse historical share movements, when merging RBS data into the new name, along with the artificially changed value of individual shares.
This Blue downtrend is thankfully verified by price movements in both 2015 and 2019, suggesting Natwest now only need exceed a current 218.964p (roughly) to start trading above the historical downtrend and start promising great things for the future. What surprises us, greatly, about this supposed break-out level is the price required is virtually identical to the share price for Natwest, when all the germs hit the pandemic fan in February 2020. With Natwest presently trading around 208p, the share price certainly does not need extend itself far to drift into territory where optimism for the longer term becomes possible.
We should point out something which makes a lot of sense. It will be exceedingly probable Natwest will experience some hesitation around the 220p level, both due to the proximity of the Blue downtrend and also, the prior pre-pandemic high. However, in the event the share manages close above the Blue line, we’re able to calculate the potential of recovery toward an initial longer term 252p with secondary, if bettered, working out at 308p.
Anything above the 308p level will require we take a hard look at the tea leaves again, due to this moving the share price into a region where some extraordinary gains become very possible.
Due to this being a UK share and worse, a UK retail bank, it’s essential we glance at possible downsides. At present, the price needs below 184p to indicate issues ahead, risking reversal to an initial 168 with secondary, if broken, at 132p. We really dislike the idea of such a secondary, given it provides a “lower low” and promises a future with the share price stuck in the doldrums.
Many thanks to those who found adverts on this page worth a visit on Friday. Really grateful!
FUTURES
| Time Issued | Market | Price At Issue | Short Entry | Fast Exit | Slow Exit | Stop | Long Entry | Fast Exit | Slow Exit | Stop | Prior |
| 1:04:44PM | BRENT | 71.71 | 71.01 | 70.8 | 70.38 | 71.7 | 72.06 | 72.3025 | 73.42 | 71.18 | |
| 1:33:14PM | GOLD | 1891 | |||||||||
| 1:39:07PM | FTSE | 7078 | |||||||||
| 2:16:54PM | FRANCE | 6525 | 6494 | 6485 | 6471 | 6519 | 6527 | 6541 | 6564 | 6494 | |
| 2:21:06PM | GERMANY | 15685 | |||||||||
| 2:24:31PM | US500 | 4229.22 | ‘cess | ||||||||
| 2:59:32PM | DOW | 34753 | ‘cess | ||||||||
| 3:38:50PM | NASDAQ | 13768 | ‘cess | ||||||||
| 3:41:22PM | JAPAN | 29178 | Shambles |
4/06/2021 FTSE Closed at 7069 points. Change of 0.07%. Total value traded through LSE was: £ 4,074,732,159 a change of -14.11%
3/06/2021 FTSE Closed at 7064 points. Change of -0.62%. Total value traded through LSE was: £ 4,744,036,832 a change of -6.04%
2/06/2021 FTSE Closed at 7108 points. Change of 0.4%. Total value traded through LSE was: £ 5,048,977,038 a change of -2.93%
1/06/2021 FTSE Closed at 7080 points. Change of 0.83%. Total value traded through LSE was: £ 5,201,214,939 a change of -13.74%
28/05/2021 FTSE Closed at 7022 points. Change of 0.04%. Total value traded through LSE was: £ 6,029,889,894 a change of -45.96%
27/05/2021 FTSE Closed at 7019 points. Change of -0.1%. Total value traded through LSE was: £ 11,159,138,786 a change of 114.44%
26/05/2021 FTSE Closed at 7026 points. Change of -0.04%. Total value traded through LSE was: £ 5,203,804,555 a change of -0.88%
SUCCESS above means both FAST & SLOW targets were met. ‘CESS means just the FAST target met and probably the next time it is exceeded, movement to the SLOW target shall commence.
Our commentary is in two sections. Immediately below are today’s updated comments. If our commentary remains valid, the share can be found in the bottom section which has a RED heading. Hopefully, this will mean you no longer need to flip back through previous reports. HYPERLINKS DISABLED IN THIS VERSION
Please remember, all prices are mid-price (halfway between the Buy and Sell). When we refer to a price CLOSING above a specific level, we are viewing the point where we can regard a trend as changing. Otherwise, we are simply speculating on near term trading targets. Our website is www.trendsandtargets.com.
UPDATE. We often give an initial and a secondary price. If the initial is exceeded, we still expect it to fall back but the next time the initial is bettered, the price should continue to the secondary. The converse it true with price drops.
We can be contacted at info@trendsandtargets.com. Spam filters set to maximum so only legit emails get through…
Section One – Outlook Updated Today. Click here for Section Two – Outlook Remains Valid shares
Click Epic to jump to share: LSE:CAR Carclo** **LSE:EZJ EasyJet** **LSE:GLEN Glencore Xstra** **LSE:NWG Natwest** **LSE:OPG OPG Power Ventures** **LSE:SBRY Sainsbury** **LSE:SPX Spirax** **LSE:TLW Tullow** **
********
Updated charts published on : Carclo, EasyJet, Glencore Xstra, Natwest, OPG Power Ventures, Sainsbury, Spirax, Tullow,
LSE:CAR Carclo. Close Mid-Price: 61 Percentage Change: + 8.93% Day High: 62.8 Day Low: 58.6
Ongoing movement against Carclo ABOVE 71 should improve acceleration towar ……..
</p
View Previous Carclo & Big Picture ***
LSE:EZJ EasyJet Close Mid-Price: 934 Percentage Change: -2.63% Day High: 960.8 Day Low: 930.6
If EasyJet experiences continued weakness below 930.6, it will invariably ……..
</p
View Previous EasyJet & Big Picture ***
LSE:GLEN Glencore Xstra. Close Mid-Price: 329.75 Percentage Change: + 1.45% Day High: 330.75 Day Low: 324.7
Continued trades against GLEN with a mid-price ABOVE 340 should improve th ……..
</p
View Previous Glencore Xstra & Big Picture ***
LSE:NWG Natwest Close Mid-Price: 207.6 Percentage Change: -1.19% Day High: 210 Day Low: 206.9
In the event of Natwest enjoying further trades beyond 210, the share sho ……..
</p
View Previous Natwest & Big Picture ***
LSE:OPG OPG Power Ventures Close Mid-Price: 15.88 Percentage Change: -2.31% Day High: 16.75 Day Low: 15.88
Continued weakness against OPG taking the price below 15.88 calculates as ……..
</p
View Previous OPG Power Ventures & Big Picture ***
LSE:SBRY Sainsbury Close Mid-Price: 265.4 Percentage Change: -1.63% Day High: 269.9 Day Low: 264.7
Further movement against Sainsbury ABOVE 269.9 should improve acceleratio ……..
</p
View Previous Sainsbury & Big Picture ***
LSE:SPX Spirax. Close Mid-Price: 12945 Percentage Change: + 0.90% Day High: 12970 Day Low: 12825
Target met. All Spirax needs are mid-price trades ABOVE 12970 to improve ……..
</p
View Previous Spirax & Big Picture ***
LSE:TLW Tullow. Close Mid-Price: 59.7 Percentage Change: + 0.98% Day High: 61.84 Day Low: 58.32
Target met. Continued trades against TLW with a mid-price ABOVE 61.84 sho ……..
</p
View Previous Tullow & Big Picture ***