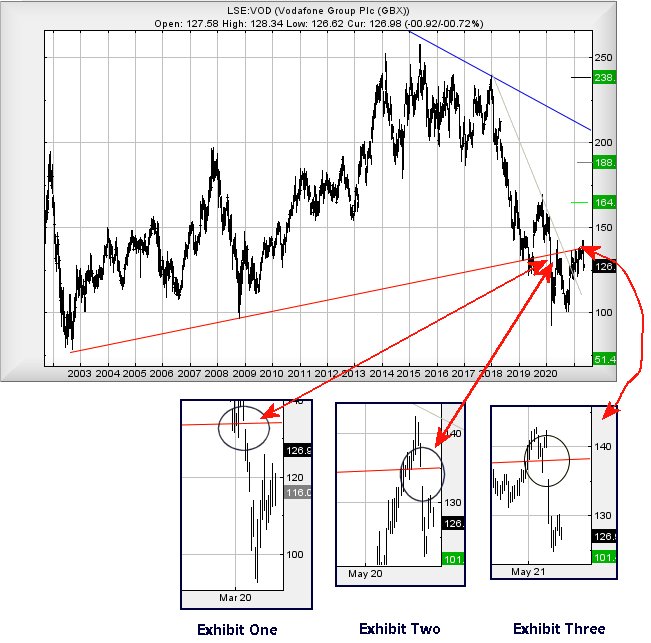
#France #SP500 There’s something extremely curious going on with the stock market and Vodafone’s share price. In fact, we’ve never seen this sort of thing before. Vodafone continues to frustrate, due to its lack of realistic movements. For instance, the drop last year to 93p was, from our perspective, arithmetically correct, reaching a calculated target and going no further. In the period since, briefly achieving 140p wasn’t the most exciting interaction with its long term Red uptrend.
This long term Red uptrend makes us question what the heck the market is playing at with Vodafone. We’ve shown three zoomed in areas where we question some price movements. It’s worth remembering the Red line dates back to 2002, clearly something the stock market attaches a lot of importance to.
Exhibit One; In March 2020, the market gapped the price below the historical Red uptrend. Not a big deal, we thought. Just a Covid thing.
Exhibit Two. In June 2020, Vodafone looked like it was enacting recovery. The market said “nope”, promptly gapping the share price down below the historical Red uptrend.
Exhibit Three. In May 2021, Vodafone yet again looked like it was trying for recovery. The market again said “nope”, gapping the share price safely below the historical Red uptrend.
While a chart pattern clearly hasn’t formed, a pattern of behaviour surely makes itself clear. In the period to which we refer, the FTSE has struggled against recovery and at times we’ve felt the market itself was the enemy, determined for the FTSE 100 to founder while European and American markets flourished. It remains a surprise how the UK AIM market, for years the “whipping boy” amongst UK indices, essentially is matching US price strengths, while the FTSE 100 does its own thing.
As gaps are, essentially, share price manipulation, it begs the question as to what’s going on? Surely if this deliberate restraint continues, some of the market grown ups must start asking questions?
We’re almost at a loss regarding Vodafone current prospects. With every attempt at recovery being reversed by “trading gaps”, we can only suspect Vodafone needs gapped UP above Red to indicate a change of heart, along with a strong suggestion pointing at sustained recovery. At present, if Vodafone exceeded 140p, we’d be fairly certain movement in the direction of 164p was ahead. If exceeded, our secondary calculates at a longer term 188p and importantly, moves the share price into pole position for challenging price levels not seen since 2016.
Thanks to the repeated gapping behaviour, we’d now experience considerable alarm if the market ever discovered an excuse to move Vodafone below 93p. Such treacherous territory allows for an ultimate bottom of 51p.
FUTURES
| Time Issued | Market | Price At Issue | Short Entry | Fast Exit | Slow Exit | Stop | Long Entry | Fast Exit | Slow Exit | Stop | Prior |
| 9:43:33PM | BRENT | 68.71 | ‘cess | ||||||||
| 10:10:44PM | GOLD | 1896.62 | |||||||||
| 10:12:35PM | FTSE | 7031.96 | |||||||||
| 10:14:36PM | FRANCE | 6395 | 6373 | 6355.5 | 6332 | 6394 | 6402 | 6412 | 6425 | 6387 | ‘cess |
| 10:29:44PM | GERMANY | 15455 | ‘cess | ||||||||
| 10:31:28PM | US500 | 4196 | 4181 | 4171 | 4159 | 4206 | 4214 | 4220 | 4233 | 4194 | |
| 10:36:42PM | DOW | 34336 | |||||||||
| 10:37:20PM | NASDAQ | Nothing new | to report. | Flat | as | a | pancake, | boring | and sleep | ing | |
| 10:38:49PM | JAPAN | 28599 | Success |

26/05/2021 FTSE Closed at 7026 points. Change of -0.04%. Total value traded through LSE was: £ 5,203,804,555 a change of -0.88%
25/05/2021 FTSE Closed at 7029 points. Change of -0.31%. Total value traded through LSE was: £ 5,249,852,674 a change of 45.96%
24/05/2021 FTSE Closed at 7051 points. Change of 0.47%. Total value traded through LSE was: £ 3,596,890,836 a change of -36.82%
21/05/2021 FTSE Closed at 7018 points. Change of -0.03%. Total value traded through LSE was: £ 5,693,397,928 a change of 0.83%
20/05/2021 FTSE Closed at 7020 points. Change of 1.01%. Total value traded through LSE was: £ 5,646,307,617 a change of -4.36%
19/05/2021 FTSE Closed at 6950 points. Change of -1.19%. Total value traded through LSE was: £ 5,903,633,845 a change of 15.89%
18/05/2021 FTSE Closed at 7034 points. Change of 0.03%. Total value traded through LSE was: £ 5,094,076,340 a change of 18.05%
SUCCESS above means both FAST & SLOW targets were met. ‘CESS means just the FAST target met and probably the next time it is exceeded, movement to the SLOW target shall commence.
Our commentary is in two sections. Immediately below are today’s updated comments. If our commentary remains valid, the share can be found in the bottom section which has a RED heading. Hopefully, this will mean you no longer need to flip back through previous reports. HYPERLINKS DISABLED IN THIS VERSION
Please remember, all prices are mid-price (halfway between the Buy and Sell). When we refer to a price CLOSING above a specific level, we are viewing the point where we can regard a trend as changing. Otherwise, we are simply speculating on near term trading targets. Our website is www.trendsandtargets.com.
UPDATE. We often give an initial and a secondary price. If the initial is exceeded, we still expect it to fall back but the next time the initial is bettered, the price should continue to the secondary. The converse it true with price drops.
We can be contacted at info@trendsandtargets.com. Spam filters set to maximum so only legit emails get through…
Section One – Outlook Updated Today. Click here for Section Two – Outlook Remains Valid shares
Click Epic to jump to share: LSE:AVCT Avacta** **LSE:CEY Centamin** **LSE:DGE Diageo** **LSE:EMG MAN** **LSE:GENL Genel** **LSE:IGAS Igas Energy** **LSE:MKS Marks and Spencer** **LSE:OPG OPG Power Ventures** **LSE:OXIG Oxford Instruments** **LSE:POLY Polymetal** **LSE:RMG Royal Mail** **LSE:SPX Spirax** **LSE:VEC Vectura** **
********
Updated charts published on : Avacta, Centamin, Diageo, MAN, Genel, Igas Energy, Marks and Spencer, OPG Power Ventures, Oxford Instruments, Polymetal, Royal Mail, Spirax, Vectura,
LSE:AVCT Avacta. Close Mid-Price: 253.2 Percentage Change: + 1.44% Day High: 253 Day Low: 243.5
This one is fairly straightforward, giving a visual representation of hesi ……..
</p
View Previous Avacta & Big Picture ***
LSE:CEY Centamin Close Mid-Price: 121.15 Percentage Change: -0.29% Day High: 123.65 Day Low: 121.25
In the event of Centamin enjoying further trades beyond 123.65, the share ……..
</p
View Previous Centamin & Big Picture ***
LSE:DGE Diageo. Close Mid-Price: 3409.5 Percentage Change: + 0.35% Day High: 3430.5 Day Low: 3388.5
In the event of Diageo enjoying further trades beyond 3430.5, the share s ……..
</p
View Previous Diageo & Big Picture ***
LSE:EMG MAN Close Mid-Price: 176.9 Percentage Change: -0.14% Day High: 179.1 Day Low: 176.15
In the event of MAN enjoying further trades beyond 179.1, the share shoul ……..
</p
View Previous MAN & Big Picture ***
LSE:GENL Genel Close Mid-Price: 137.4 Percentage Change: -1.58% Day High: 139.6 Day Low: 136.4
Continued weakness against GENL taking the price below 136.4 calculates a ……..
</p
View Previous Genel & Big Picture ***
LSE:IGAS Igas Energy Close Mid-Price: 20 Percentage Change: -1.96% Day High: 20.8 Day Low: 19.2
Continued weakness against IGAS taking the price below 19.2 calculates as ……..
</p
View Previous Igas Energy & Big Picture ***
LSE:MKS Marks and Spencer. Close Mid-Price: 169.2 Percentage Change: + 8.50% Day High: 173.25 Day Low: 158.85
Further movement against Marks and Spencer ABOVE 173.25 should improve ac ……..
</p
View Previous Marks and Spencer & Big Picture ***
LSE:OPG OPG Power Ventures Close Mid-Price: 16.75 Percentage Change: -2.90% Day High: 17.25 Day Low: 16.75
Weakness on OPG Power Ventures below 16.75 will invariably lead to 14p. I ……..
</p
View Previous OPG Power Ventures & Big Picture ***
LSE:OXIG Oxford Instruments. Close Mid-Price: 2060 Percentage Change: + 0.24% Day High: 2150 Day Low: 2010
Continued trades against OXIG with a mid-price ABOVE 2150 should improve ……..
</p
View Previous Oxford Instruments & Big Picture ***
LSE:POLY Polymetal. Close Mid-Price: 1712.5 Percentage Change: + 0.97% Day High: 1731.5 Day Low: 1706.5
All Polymetal needs are mid-price trades ABOVE 1731.5 to improve accelera ……..
</p
View Previous Polymetal & Big Picture ***
LSE:RMG Royal Mail. Close Mid-Price: 595.8 Percentage Change: + 1.64% Day High: 600.8 Day Low: 587.4
Continued trades against RMG with a mid-price ABOVE 600.8 should improve ……..
</p
View Previous Royal Mail & Big Picture ***
LSE:SPX Spirax. Close Mid-Price: 12575 Percentage Change: + 1.13% Day High: 12615 Day Low: 12370
Target met. Further movement against Spirax ABOVE 12615 should improve ac ……..
</p
View Previous Spirax & Big Picture ***
LSE:VEC Vectura. Close Mid-Price: 163.2 Percentage Change: + 33.77% Day High: 163.8 Day Low: 159.4
Target met. Continued trades against VEC with a mid-price ABOVE 163.8 sho ……..
</p
View Previous Vectura & Big Picture ***