#FTSE for FRIDAY We’ve a frequent problem with ‘Chart Patterns’, not least being their utter unreliability. It’s often the case of something being true for one market proving to be the exact opposite in another. Movements recently with the FTSE & #WallSt are providing a perfect case in point, allowing us to enter ‘teaching mode’ for a welcome change. The two charts below, dealing with the FTSE and Wall St show an interesting movement with each index. Our point, essentially, would be a strong suspicion Wall St would be about to surge upward, if only the US index had produced similar movements to the UK.
When an American index enacts this sequence;
- Break the trend
- Follow the trend from below
- Exceed the level of the original trend break and regains the prior trend.
; we’ve learned to expect surprise future strength. When we apply our US model to the UK index, it translates with the potential of coming growth toward 7,040 points.
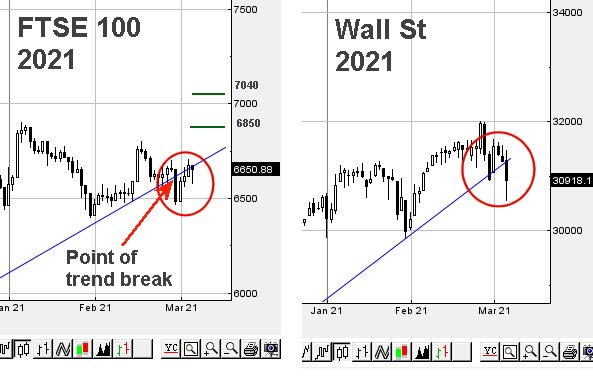
Unfortunately, a US model will rarely prove reliable when applied elsewhere, doubtless reflecting differences in thought processes from one side of the Atlantic to the other. In America, perpetual hope which is backed up by action. “It’s broken trend. No worries, it’s going up again and look, it just regained the trend. BUY”
But in Europe, “It’s broken trend. Don’t trust it, the value is increasing but it just proved the trend line was weak. SELL!”
It’s easy to snigger about this sort of nonsense but there’s little doubt the eternal optimism of America is a commodity often only found amongst the gullible in British internet chatrooms for certain AIM shares. If anyone is interested, we rather suspect the movement in the US index is a warning for imminent reversal to around 29,900 points, a level at which we’d hope for a rebound.
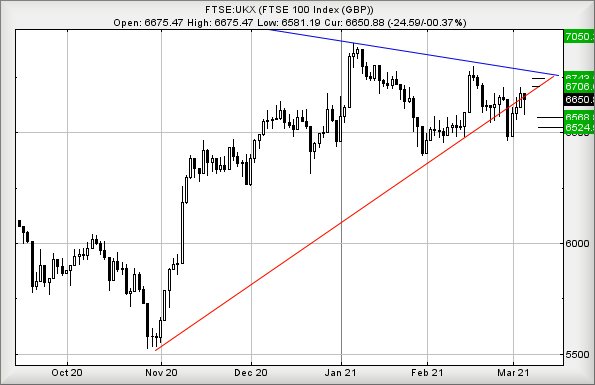
As for the FTSE for FRIDAY, there are some slight potentials showing as above 6670 points calculates with an initial ambition of 6708 points with secondary, if exceeded, at 6743 points. If triggered, the very tightest stop looks wide at 6615 points.
The alternate scenario allows for weakness below 6608 to drive reversals to an initial 6568 with secondary, when broken, at 6523 points.
And on the bright side, it’s now just 21 days until Formula1 kicks off in Bahrain.
FREE FIRST MOVE FUTURES
| Time Issued | Market | Price At Issue | Short Entry | Fast Exit | Slow Exit | Stop | Long Entry | Fast Exit | Slow Exit | Stop | Prior |
| 9:50:03PM | BRENT | 66.8 | 63.95 | 63.075 | 65.83 | 67.59 | 68.48 | 64.8 | Success | ||
| 9:53:03PM | GOLD | 1698 | 1690 | 1674 | 1740 | 1722 | 1733.5 | 1706 | ‘cess | ||
| 9:54:32PM | FTSE | 6604.48 | 6563 | 6531.5 | 6604 | 6670 | 6683 | 6612 | ‘cess | ||
| 9:56:38PM | FRANCE | 5789.2 | 5768 | 5744 | 5796 | 5804 | 5816.5 | 5770 | ‘cess | ||
| 9:59:25PM | GERMANY | 13967 | 13947 | 13885 | 14008 | 14098 | 14139 | 13998 | ‘cess | ||
| 10:12:43PM | US500 | 3767 | 3721 | 3678 | 3777 | 3795 | 3812.5 | 3745 | Success | ||
| 10:18:02PM | DOW | 30943 | 30740 | 30439.5 | 30972 | 31026 | 31184 | 30796 | Success | ||
| 10:21:15PM | NASDAQ | 12445 | 12308 | 12216 | 12546 | 12628 | 12698 | 12415 | Success | ||
| 10:24:01PM | JAPAN | 28932 | 28700 | 28593 | 28985 | 29195 | 29346.5 | 28995 | Success |