#FTSE #WallSt The UK index is presently doing “a thing” we used to be keen on witnessing from Wall St. It’s important to remember most chart patterns are utter nonsense but chart behaviour is often something else, essentially creating a map of human behaviour. And unlike human behaviour, it sometimes makes sense too.
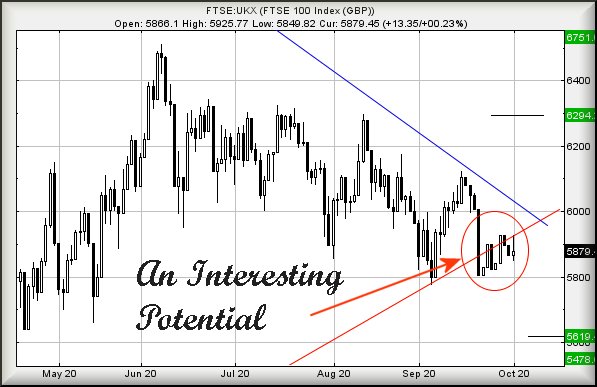
This dive into “fascinating” comes from a break of the market uptrend, since the Covid-19 drop in March. On Sept 20th, the UK index barged through the trend with similar aplomb to a Scottish MP, when faced with Covid-19 regulations (and common sense and common decency). By slicing below 5863 points, the FTSE entered territory where we’d normally be comfortable pointing out weakness next below 5800 points risks a reversal cycle to 5619, perhaps even 5478 points.
However, Wall St has been guilty of producing trend breaks which are followed up by very tentative recovery dance steps. When an index breaks a trend, then the market creeps up the trend line (circled in Red), in the case of the USA it generally means surprise recovery is coming, due to the market not actually experiencing a loss of confidence due to the trend break. Quite the opposite may be happening as an index constantly gaining in value may indicate the potential of sudden strengthening of confidence. While it’s rare for the UK to exhibit this sort of movement, it’s something we watch for against the American markets.
In the case of the UK, the scenario presently exists where the potential of surprise recovery to 6294 calculates as an initial target. Secondary works out at a longer term 6751 points. If taking this at face value and opting to open a speculative Long position, the market even offers 5800 points visually as the tightest stop loss level! It’s certainly an interesting scenario with a massive Risk/Reward ratio. We’re obviously nervous, thanks to the pandemic soup in which we swim, presently.
FTSE for FRIDAY The foregoing section, while giving the impression of optimism, cleverly avoided giving any confident clue as to actual market direction in the near term. Normal rules suggest we should anticipate reversals.
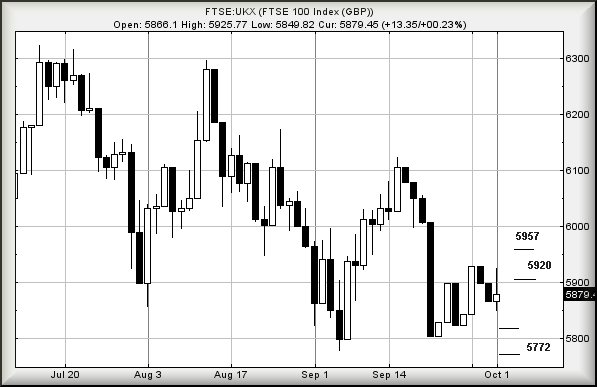
Weakness next below 5846 suggests the potential of reversals to an initial 5817 points with secondary, if broken, at 5772 points. If triggered, the tightest stop is at 5902 points.
Alternately, above 5902 points calculates with an initial tame 5920 points with secondary, if exceeded, calculating at 5957 points. Unfortunately, as we enter the final day of the week, we’ve no clear idea of what to expect in the near term.
Have a good weekend.
FUTURES
| Time Issued | Market | Price At Issue | Short Entry | Fast Exit | Slow Exit | Stop | Long Entry | Fast Exit | Slow Exit | Stop | Prior |
| 10:50:06PM | BRENT | 40.75 | 41.4 | 39.53 | 41.1 | 41.45 | 41.685 | 40.59 | ‘cess | ||
| 10:53:12PM | GOLD | 1906.39 | 1893 | 1887.5 | 1903 | 1913 | 1918 | 1902 | ‘cess | ||
| 11:05:55PM | FTSE | 5876 | 5847 | 5836.5 | 5887 | 5900 | 5936 | 5854 | |||
| 11:07:43PM | FRANCE | 4821 | 4800 | 4776 | 4832 | 4871 | 4878 | 4826 | |||
| 11:09:34PM | GERMANY | 12713 | 12669 | 12640 | 12754 | 12809 | 12835 | 12725 | |||
| 11:11:25PM | US500 | 3374 | 3360 | 3347.5 | 3388 | 3397 | 3403.5 | 3374 | |||
| 11:18:14PM | DOW | 27829 | 27662 | 27583 | 27862 | 28081 | 28137.75 | 27898 | Shambles | ||
| 11:20:00PM | NASDAQ | 11598 | 11447 | 11402.5 | 11528 | 11612 | 11635.5 | 11506 | ‘cess | ||
| 11:21:40PM | JAPAN | 23317 | 23200 | 23176 | 23313 | 23373 | 23434 | 23256 |