#Brent #Germany At risk of sounding like a Xmas cracker, we’re returning to our favourite “When is a Trend NOT a Trend?” subject, especially as the retail banks continue to prove neither uptrends nor downtrends dare be trusted. #Barclays has delivered a perfect ‘case in point’, recent price movements tending rubbish any immediate notion as to what’s actually going on!
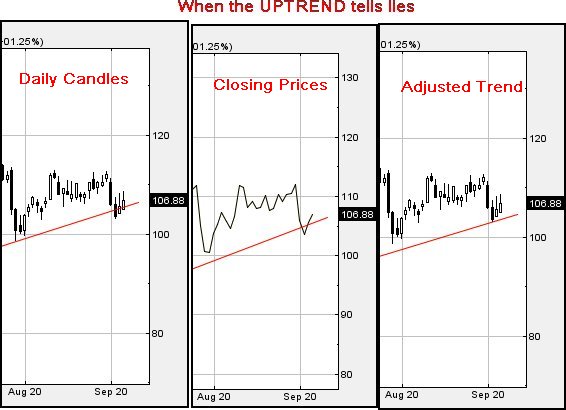
The illustrations below deal with two recent Barclays scenario, where both the uptrend and downtrend lied. We’ve a fairly big rule, in house, about the price level when a share price breaks trend. Basically, this is the point when you no longer dare assume a share price intends move in whatever direction is suggested. In the case of “When the UPTREND tells lies”, it’s pretty straightforward as Barclays share price broke trend at 105p. This carried the immediate threat of some true reversals about to occur. However, the very next day, the share price recovered above the trend and this suggests only one thing. The Red line, the uptrend since March, was incorrect as the market isn’t really paying any attention to it.
What’s the solution?
Redraw the line, adjusting the bottom level against the recent low. It now implies Barclays must next trade below 104p before raising an eyebrow. We prefer a more logical approach, demanding the share trade below the previous trend break low before panic, in this case insisting on 103p breaking before becoming pretty certain some reversals are really coming. More on this below.
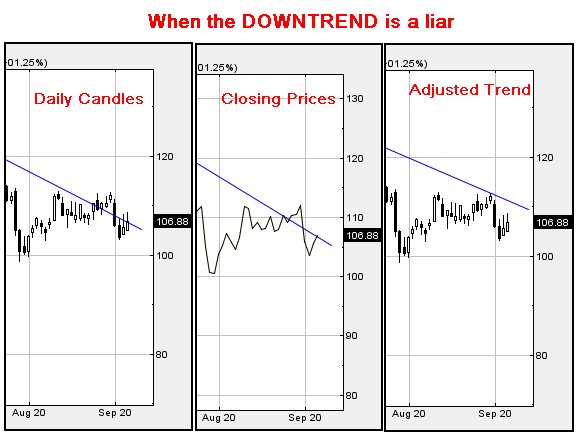
Equally, there’s the BLUE downtrend, again the source of recent trend malpractice with Barclays…
This particular line since June really looked convincing, suggesting the share price needed break 110p to provide a convincing break of the trend. Folk who read our last analysis from mid-August would be aware, we’d demanded the price really needed better 114p to be taken seriously as we already distrusted the downtrend. This proved to be the case, the share price managing to break trend and soar, uselessly, to 112.7 before once again retreating below Blue. It was clear the downtrend did not merit any level of trust, so we adjusted it. Barclays now needs exceed 112p to break above trend, unfortunately just a box ticking exercise as our software now demand the share price exceeds 117.5p before we dare suspect moves have any integrity.
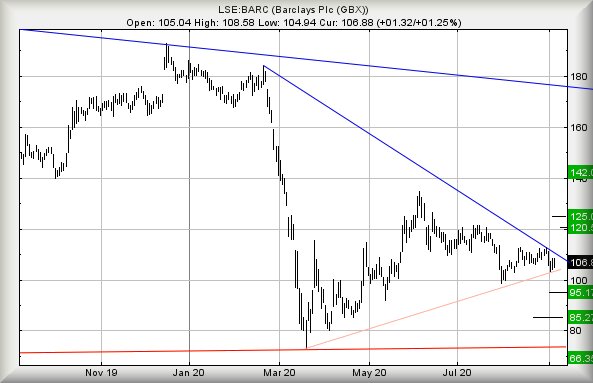
Finally, we can move to our immediate thoughts for Barclays share price.
Above 117.5p should now prove capable of a lift to an initial 120.5p with secondary, if exceeded, a rather more useful looking 125p. Our interest in the 125p target level is piqued, due to this potentially allowing the price to CLOSE above a series of previous highs in July, potentially creating a higher-high situation which will signal some proper price recovery toward 142p.
The flip side of the coin comes with the 103p level as mentioned in our opening paragraphs. Movement below this level now risks triggering reversal to an initial 95p with secondary, when (or if) broken at 85p and hopefully a rebound. The implications below 85p are quite difficult to believe, challenging the lows of the financial sector crash from 2009.
FUTURES
| Time Issued | Market | Price At Issue | Short Entry | Fast Exit | Slow Exit | Stop | Long Entry | Fast Exit | Slow Exit | Stop | Prior |
| 7:21:58AM | BRENT | 42.48 | 42.4 | 41.96 | 41.5 | 43 | 43.6 | 43.815 | 44.28 | 42.72 | Shambles |
| 7:45:58AM | GOLD | 1934 | |||||||||
| 3:07:29PM | FTSE | 5829 | Shambles | ||||||||
| 3:12:57PM | FRANCE | 5006 | Success | ||||||||
| 3:15:43PM | GERMANY | 12932 | 12901 | 12802 | 12693 | 13017 | 13100 | 13147.5 | 13281 | 12905 | Shambles |
| 3:18:01PM | US500 | 3415 | Success | ||||||||
| 3:21:32PM | DOW | 28079 | ‘cess | ||||||||
| 3:24:03PM | NASDAQ | 11543 | Success | ||||||||
| 3:28:38PM | JAPAN | 23173 |
