#Gold #SP500 In our glance at “what if it all goes wrong” share prices, the style of Covid-19 Mortality presentation reminds of the awful football results program on Saturday afternoons in the 1970s. In a house awaiting Dr Who on a Saturday evening, the dirge of dreary football results was detested. How could the BBC even think people were interested in football! For those who ignore history, in the 1970s there were mostly 3 TV channels showing garbage, mostly. Aside from the number of channels, the output remains the same, mostly.
It was something of a surprise to discover Manchester United are listed on the New York Stock Exchange, their share price behaving with greater probity than witnessed a few years ago when we covered Glasgow Ranger’s listing, an offering which ended in tears and tantrums. The debate continues, are the current Rangers Football Club an entirely new business or one justified in displaying trophy’s won by the original team?
An article on players’ salaries informed us, alongside an obvious risk of Sky TV wanting their money back for games unplayed, some trouble is queuing up to give football clubs a bit of a kicking.
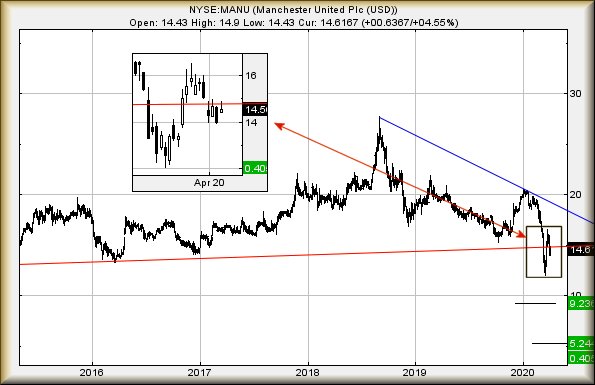
For Manchester United, we’ve allocated a trigger level at 11.4 dollars, the scenario suggesting weakness below such a level allows a shot in the direction of 9.2 dollars. If broken, our secondary calculation (and the point at which we’d REALLY hope for a bounce) works out at 5.2 dollars.
There’s a very big problem if any initial surge breaks below 5.2 as we cannot comfortably calculate an ultimate bottom. Perhaps 0.4 will suffice, perhaps not. Regardless, it looks absolutely absurd. Equally difficult for the naked eye to digest (?) is the downtrend since 2018 as it suggests Manchester’s share price needs exceed 19.1 dollars presently to suggest it’s climbing out of trouble. At present, the price is showing an unhealthy fascination for the uptrend (Red) since 2012, the price oscillating above and below this historical remnant. This sort of holding pattern, following a previous break of a trend, never fills us with confidence.

FUTURES
| Time Issued | Market | Price At Issue | Short Entry | Fast Exit | Slow Exit | Stop | Long Entry | Fast Exit | Slow Exit | Stop | Prior |
| 10:14:14PM | BRENT | 33.78 | |||||||||
| 10:16:16PM | GOLD | 1662.52 | 1630 | 1618.5 | 1602 | 1644 | 1669 | 1683.75 | 1717 | 1630 | Success |
| 10:19:19PM | FTSE | 5634.84 | Success | ||||||||
| 10:28:57PM | FRANCE | 4396.5 | ‘cess | ||||||||
| 10:31:20PM | GERMANY | 10218 | Success | ||||||||
| 10:34:29PM | US500 | 2657 | 2572 | 2552.5 | 2511 | 2600 | 2661 | 2674.5 | 2754 | 2596 | Success |
| 10:37:01PM | DOW | 22633 | Success | ||||||||
| 10:38:57PM | NASDAQ | 8051.75 | Success | ||||||||
| 10:40:53PM | JAPAN | 18872 | Success |
6/04/2020 FTSE Closed at 5582 points. Change of 3.08%. Total value traded through LSE was: £ 6,188,185,847 a change of 7.79%
3/04/2020 FTSE Closed at 5415 points. Change of -1.19%. Total value traded through LSE was: £ 5,740,716,351 a change of -13.64%
2/04/2020 FTSE Closed at 5480 points. Change of 0.48%. Total value traded through LSE was: £ 6,647,447,638 a change of -4.67%
1/04/2020 FTSE Closed at 5454 points. Change of -3.83%. Total value traded through LSE was: £ 6,973,403,008 a change of -12.8%
31/03/2020 FTSE Closed at 5671 points. Change of -1.6%. Total value traded through LSE was: £ 7,996,950,957 a change of 37.36%
30/03/2020 FTSE Closed at 5763 points. Change of 4.59%. Total value traded through LSE was: £ 5,821,744,739 a change of -29.22%
27/03/2020 FTSE Closed at 5510 points. Change of -5.25%. Total value traded through LSE was: £ 8,225,273,197 a change of 4.62%