#DOW #Gold #FreeFutures We really hate sounding like panic merchants. Our commentary last Friday showed 5,260 on the chart, a number we felt worthy of display but we didn’t bother explaining the rational in the analysis. So, a drop of 1,467 points in a week saw the market close Thursday at 5,237 points. This is known as ‘ headless chicken’ territory…
What next, given the UK market closed a session below a major target level?
Rather surprisingly, we suspect some sort of rebound must be on the horizon, if only to allow the market to gather sufficient weight for future reversals. But we’re pretty far from confident any rebound will “stick”, given the FTSE is now trading lower than any point since 2012. We should probably abandon our inherent caution, instead adopting similar levels of misery to that adopted by a TV reporter interviewing a doctor.
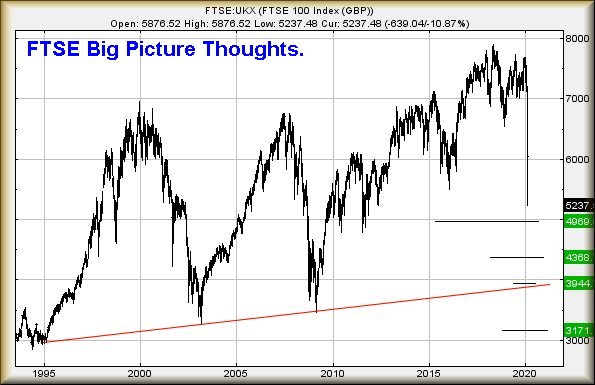
The Big Picture now suggests weakness below 5237 should bring travel down to an initial 4969 points with secondary, if broken, at 4368 points. In fact, secondary could find itself at 3944, thanks the the market being manipulated downward at the open recently. Visually, there would normally be ample reason to hope for a rebound around the 4969 point but experience during March (hasn’t this been a long month!) constantly warns the only thing to expect is disappointment.
The market has been forcing the market down quite firmly!
This absurd suggestion comes, thanks to movements made in the opening second of trade. On the days the market was not actively forced downward at the open, reversals experienced were ‘only’ 60 and 70 points respectively. On the other two days this week, the market itself forced prices down at the open, creating an environment of panic. It’s certainly quite sobering to reflect on market reversals being caused by the market itself, perhaps taking advantage of an epidemic to maximise on a climate of fear.
Should the FTSE now manage below 3944 points, we’re looking at eventual reversal to a bottom (hopefully) of 3171 points. If achieved, this will be lower than 2009 and also, the crash of 2003.
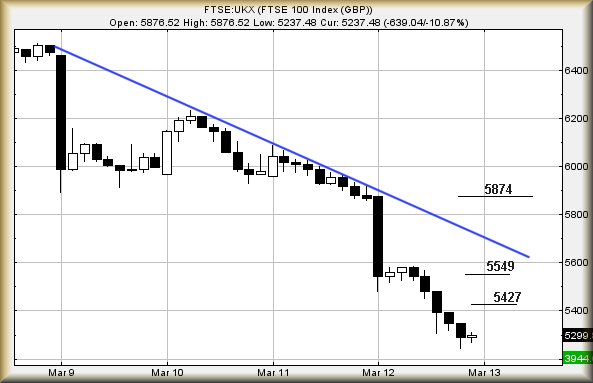
Near term, we’ve a slight suspicion some sort of bounce may occur, so we’ll focus on recovery scenario first.
Above 5311 points is supposed to provoke recovery to a useless 5345 points. If exceeded, our secondary calculates up at 5427 points. And given the pace of descent, we can give a third target level, up at 5549 points, effectively the level the market stabilised for most of Thursdays session. If triggered, the tightest stop is at 5237 points.
Even for near term reversal potentials, we suggest looking at the Big Picture scenario above. Things are moving fast.
|
Time Issued |
Market |
Price At Issue |
Short Entry |
Fast Exit |
Slow Exit |
Stop |
Long Entry |
Fast Exit |
Slow Exit |
Stop |
Prior |
|
10:51:23PM |
BRENT |
33.49 |
33.11 |
30.91 |
35.22 |
35.21 |
36.03 |
33.77 |
‘cess | ||
|
10:54:54PM |
GOLD |
1576 |
1560 |
1549 |
1591 |
1609 |
1614 |
1566 |
Success | ||
|
11:09:21PM |
FTSE |
5273 |
5194 |
5169 |
5354 |
5467 |
5620 |
5280 |
Success | ||
|
11:11:29PM |
FRANCE |
3958 |
3943 |
3876.5 |
4103 |
4125 |
4172.5 |
4027 |
‘cess | ||
|
11:14:37PM |
GERMANY |
8985 |
8843 |
8808 |
9121 |
9121 |
9195 |
8873 |
Success | ||
|
11:18:22PM |
US500 |
2452 |
2420 |
2372 |
2487 |
2553 |
2601 |
2492 |
Success | ||
|
11:26:14PM |
DOW |
20934 |
20552 |
20480 |
21219 |
21555 |
21866 |
21220 |
Success | ||
|
11:30:27PM |
NASDAQ |
7162.12 |
7059 |
6827 |
7486 |
7246 |
7302 |
7140 |
Success | ||
|
11:33:19PM |
JAPAN |
17238 |
16949 |
16772.5 |
17542 |
17542 |
17646 |
17229 |
Success |
