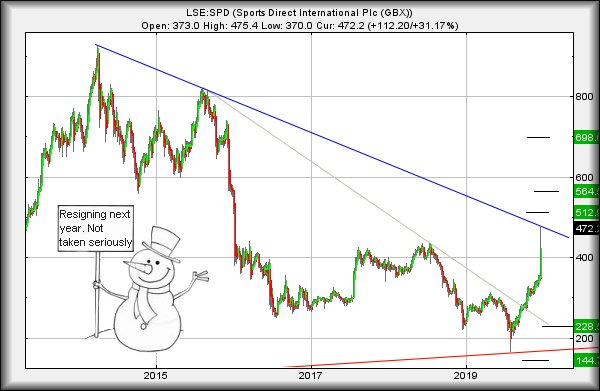
#Gold #SP500 Sometimes we’re surprised at the sheer speed of a price movement, when criteria are satisfied. In the case of #SportsDirect, our analysis in September (link) suggested price levels above which the share almost “had” to move. It moved and now, resides in what’s commonly called ‘Game Changing’ territory.
To be fair, it’s ALMOST in Game Changing territory.
There’s a tiny little problem with the price visuals and it relates to a
downtrend which began in April 2014. Currently this trend line is at 474.736p
and the market opted to close Sports Direct at 472.2p. It’s almost like someone
had a crayon, drew a line, and said “No Further!”. If the situation is indeed to
prove Game Changing, the first box we require ticked is of the share price
actually closing a session above the Blue line on the chart.
The immediate situation gives some hope as movement
near term exceeding 476p is supposed to head upward to an initial 512p. If we
play safe and sane, only with moves beyond 512p dare we believe future recovery
to an initial 564p makes sense. If exceeded, our Big Picture secondary
calculates at 698p and visually, this sort of level appears to be a Glass
Ceiling in Waiting for the future.
At present, it’s pretty difficult to define a danger
level for the price. Movements since September suggest the share requires below
290p to justify panic as this could easily provoke a reversal cycle to 144p.
We’d suspect the company would need announce a sponsorship deal with Russian
athletes for the forthcoming Olympics, if they’re serious about driving the
price down.
For now, quite a lot of hope remains for Sports Direct
share price and we think it shall prove a matter of patience, along with
positive overall market conditions.
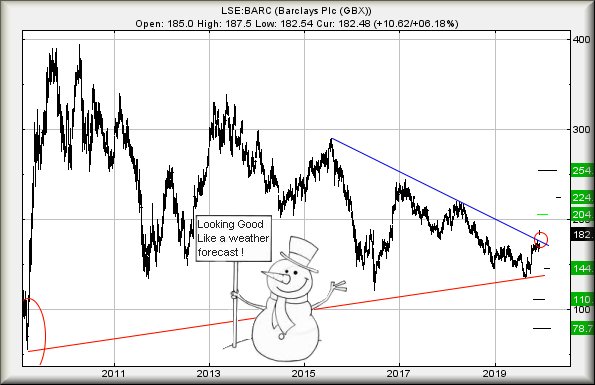
#Brent #Dax The Xmas Gestapo never forget! After an elm tree in the front garden was decorated with twinkle lights, the lady of the house drove past repeatedly, clambered down to the shore to inspect the job, eventually admitting the display was ‘safe’. A “Top Gear / Grand Tour” inspired illuminated manhood shape still has not been forgotten nor forgiven. Talking of which, Barclays springs to mind and their surprise elevation on Friday with the election result.
Our previous report (link)
suggested criteria to drag Barclays up to 187p, a feat it achieved on Friday. We
now need examine its potentials with greater scrutiny than Mrs T&T employed with
the exterior Xmas light placement. (Thankfully, she did not
fly a drone over the back garden! With LED lighting available at 4 quid for 10
metres, creative design proved easy.)
A detail of enormous importance and one worth watching
for is the risk of the market finding an excuse to reverse Barclays below Blue
on the chart. This could easily create one of our GaGa movements, a Gap Up/Gap
Down. The formula we employ with this sort of nonsense indicates should Barclays
share price now be trashed below Blue (presently 173p), it’s going to find its
way down to 110p eventually.
At present, absolutely nothing suggests this is coming
but it’s worth remembering something important about politics. Often, something
which looks good on the day, looks rather jaded, when examined in detail!
For now, we’re pretty impressed with the shares
immediate performance and now, movement above 188p is supposed to be capable of
an initial 204p. Despite the 2 quid level visually suggesting a ‘glass ceiling
in waiting’, we’re not so sure as above 204p should make 224pp difficult to
avoid.
In summary, quite a lot of hints are saying this
intends 204p. Beyond such a level and we start to develop doubts.
Updated charts published on : AFC Energy, Barclays, BALFOUR BEATTY, Barrett Devs, Bowleven, BP PLC, Capita, Diageo, EasyJet, Foxtons, Hargreaves Lansdown, Hurrican Energy, British Airways, Igas Energy, IG Group, Intercontinental Hotels Group, ITV, Kaz Minerals, Lloyds Grp., Marks and Spencer, National Glug, Premier, Quadrise, Royal Bank Scot, Royal Male, Sainsbury, Speedyhire, Tullow, Tesco, Taylor Wimpey, Zoldav, Zoo Digital,
LSE:AFC AFC Energy Close Mid-Price: 14.47 Percentage Change: -3.02% Day High: 15.5 Day Low: 14.05
This remains dangerous as below 11.7 now gives 10.3 with some rebound pote ……..
*** End of “Updated Today” comments on shares. Listed below are those where commentary remains valid.
Click Epic to jump to share:LSE:AGM Applied Graph.** **LSE:AMER Amerisur** **LSE:ASC Asos** **LSE:AV. Aviva** **LSE:BLOE Block Energy PLC** **LSE:BPC Bahamas Pet** **LSE:BT.A British Telecom** **LSE:CAR Carclo** **LSE:CASP Caspian** **LSE:CBUY Cloudbuy** **LSE:CCL Carnival** **LSE:CEY Centamin** **LSE:ECO ECO (Atlantic) O & G** **LSE:EME Empyrean** **LSE:EMG MAN** **LSE:EXPN Experian** **LSE:FGP Firstgroup** **LSE:FRES Fresnillo** **LSE:GENL Genel** **LSE:GKP Gulf Keystone** **LSE:GLEN Glencore Xstra** **LSE:HIK Hikma** **LSE:HSBA HSBC** **LSE:IPF International Personal Finance** **LSE:IQE IQE** **LSE:LMI LonMin** **LSE:OPG OPG Power Ventures** **LSE:OXIG Oxford Instruments** **LSE:PMG Parkmead** **LSE:POG Petrop etc** **LSE:POL Polo Resources** **LSE:POLY Polymetal** **LSE:PPC President Energy** **LSE:RBD Reabold Resources PLC** **LSE:RED REDT** **LSE:RKH Rockhopper** **LSE:RR. Rolls Royce** **LSE:SCLP Scancell** **LSE:STAN Standard Chartered** **LSE:SUMM Summit** **LSE:SXX Sirius Mins** **LSE:TAN Tanfield** **LSE:UKOG UK Oils and Gas** **LSE:VEC Vectura** **LSE:VOD Vodafone** **LSE:VOG VICTORIA** **LSE:WTG Watchstone** **
********
Many thanks for taking the time to read this and good luck for today. Please feel free to mention us after something goes right!
Risk Warning & Notice to Investors
Buying, selling and investing in shares is not without risk. Market and company movement will affect your performance and you may get back less than you invest. Neither Trends and Targets Ltd, Shareprice, or Interactive Investor will be responsible for any losses that may be incurred as a result of following a trading idea.
#DOW #DAX Providing an outlook for Friday 13th December is proving quite difficult. It appears reasonable to assume the Battle of Clowns in the UK has tended confuse the market, recent movements appearing decidedly hesitant with share prices extremely difficult to map from a near term perspective. The market has proven to be at risk from the next stupid headline, each designed to make voters fear “the other guy”.
A glance at European papers essentially reveals the UK
is being laughed at, quite a surprising feat considering Spains two general
elections this year, along with the countries political prisoners. Elsewhere,
Sweden joined Italy in suggesting UK voters would be holding their nose, whilst
voting. All in all, not a flattering picture for an election and probably not
the ideal image for our country!
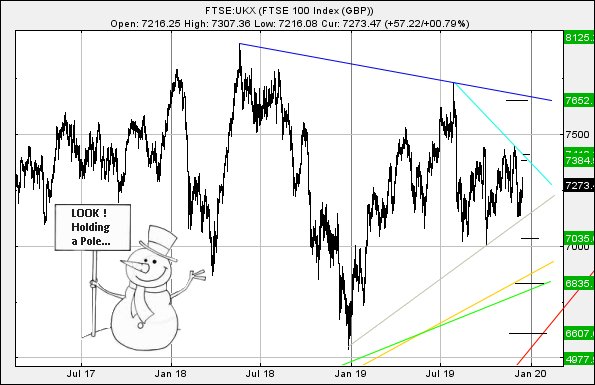
As for Friday, it’s worth taking an updated look at the
FTSE medium term, specifically the Index during opening hours and not FTSE
Futures. Above 7309 now suggests traffic in the direction of 7384 points. If
exceeded, secondary is a more enlightened 7410 points. Visually, there are
plenty of reasons to anticipate a stumble around the 7400 level as we suspect
only closure above 7410 shall prove capable of igniting a longer term rally
toward the 7650 level.
Of course, as always there’s a flip side to the
argument. If the market perceives the election result negatively, reversal below
7193 could easily provoke travel down to an initial 7036 points. If broken,
secondary is at 6936 and hopefully some sort of rebound.
While writing this headline section, the media
announced the “Exit Poll” and market futures reacted positively. As a result, we
shall not be surprised to see our upward targets around the 7400 level achieved
– if the poll turns out to be correct. It’s going to be a long night as the only
thing which matters is the actual result.
However, it appears Friday shall prove to be an UP day
on the FTSE.
#Japan #France Reports of a rock shaking turn out to be true. Apparently our ex-PM Mrs May is laughing her head off, despite retiring to reside under her rock. Most folk assumed this election could not be managed quite as incompetently as the last one, a belief proving to be hilariously incorrect. Worse, it has totally fouled up the markets as we generally hope the UK index will give a clue. Unfortunately, the FTSE has positioned itself in the Thunderbirds zone – “anything can happen in the next 14 hours!”.
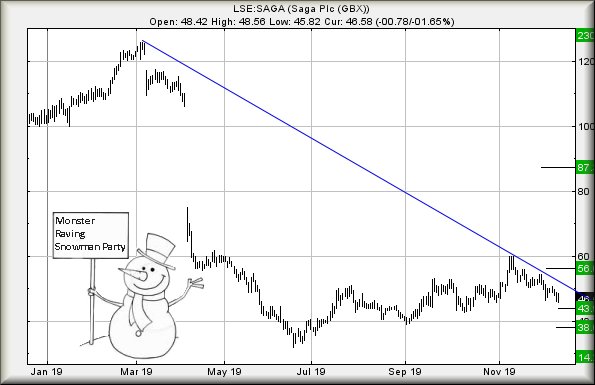
Thoughts of retired PM’s resurrected an excuse to
review SAGA, the company who prey on old, miserable, bald, people. Or those
who’re over 50.
Recent price movements against Saga are not terribly
encouraging, though we suspect it shall find some sort of excuse for a bounce
anytime soon. As the chart shows, price moves are carefully following the
downtrend. This sort of nonsense will generally complete with a sudden spike
downward, followed by a rebound. In the case of Saga, weakness now below 45.5
suggests coming travel down to an initial 43p. If such a level breaks, it
calculates with a secondary at 38p and hopefully a proper bounce.
In the event the price manages exceed Blue on the chart
(presently 52.8) we’re looking at an initial ambition of 56p with secondary, if
bettered, a longer term 87. We strongly, very strongly, suggest holding fire on
that 87p until such time the price actually closes above 56p. In addition,
there’s a very obvious Glass Ceiling awaiting at 60p, one which shall doubtless
be employed to create some hesitation.
On the “down side” of things, we’d be quite alarmed if
Saga now dropped below 32p as 14p presents the lowest we can calculate.
In summary, we think this shall be worth watching for a
spike down at the open in the days ahead. The visuals suggest this should be
used to jump start a rising cycle.
#FTSE #NASDAQ It’s funny but after nearly 30 years of marriage, stumbling into stupid mistakes remains easy. A simple sentence, “the tree looks nice but do you know it’s leaning to the left” provoked a surprising degree of vitriol. It’s easy to forget, a Christmas tree diva does not take criticism well when hours of work are honestly assessed.
The lack of anything resembling a “chill pill” was
highlighted, as usual bringing thoughts of cannabis to the fore. Not because of
a need to smoke it, just a sad reminder of how virtually impossible it is to not
buy genuine CBD oil in the UK. Personal experience, using the stuff to manage
pain from an illness, taught of its amazing effects. Now, sadly, due to a tweak
to UK Customs controls, real CBD is no longer on the market. Instead, we have
products using the moniker but a glance at the ingredient list invariably
reveals the weasel words, “made from hemp”, ensuring it has no real value
medicinally.
However, we live in hope for change and keep an eye on
cannabis share prices also, suspecting the UK shall follow where Canada and the
US lead.
We must stress, this legendary product “CBD Oil” has
absolutely no psychotropic effect. It just (for the writer anyway) removed the
need for potentially addictive opioid based painkillers.
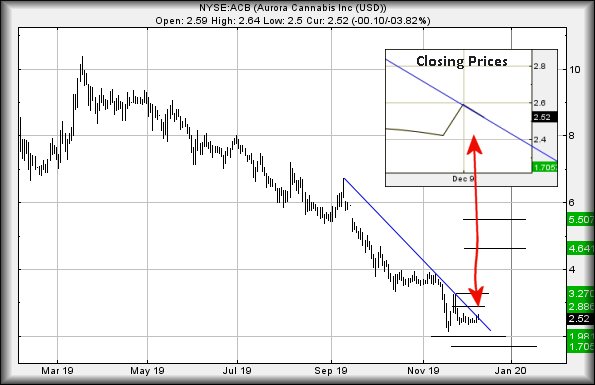
The inset on the chart highlights something fascinating
with recent price movements for Aurora. At time of writing, the share price is
at 2.52 dollars and the downtrend is at 2.40 dollars. For the last couple of
sessions, the price has mirrored the Blue downtrend and, despite the visuals,
has closed above the immediate trend. This gives slight hope “something” is due
to happen.
We’d regard movement now above 2.64 as capable of
provoking an initial 2.88 dollars. If exceeded, secondary calculates at 3.27.
The important detail about the secondary is it risks
being fairly game changing. In the event the price manages above 3.27 on an
initial surge, ongoing recovery to 4.64 and beyond is expected.
All this hope is based on the price visually managing
to avoid our big picture bottom target of 1.98. The share bounced, just above
this target level and implies some hope for the future. The detail of it
actually trading above the immediate trend, again implies some hope.
#Gold #US500 If our suspicion of major markets actually showing some strength proves correct, logically Gold should experience some contrary movement. For today, we’re taking a Big Picture update on Gold and the DAX. When viewed together, they present an interesting potential.
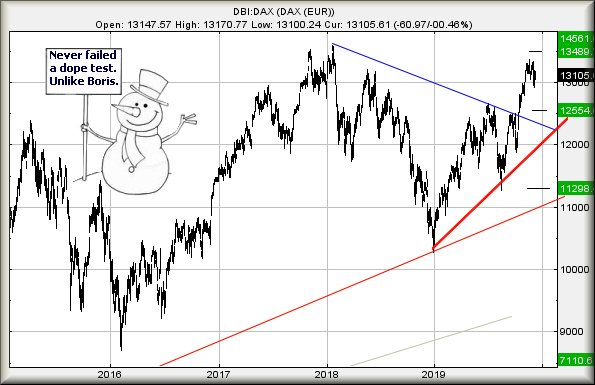
Our most recent review against the DAX presented
an initial target of 13,240. Secondary, if bettered, was up at 13,652 points.
This has changed.
The index indeed achieved our primary target level,
exceeding it quite nicely for a few sessions and has spent the last couple of
weeks oscillating above and below our 13,240. We’re now able to update this
index’ potentials, should it opt to break free of the current hiatus. Apparently
movement now above 13,340 should attempt further growth to an initial 13,489
points. If exceeded, secondary now calculates at 14,561, a new all time high and
a point at which we’d expect some pretty serious turbulence.
For it all to go wrong against the DAX, the index now
needs fall below 12,450 points. Visually there appears little danger of this,
the most imminent tripwire being the potential of weakness below 12,900
triggering reversal to 12,554 points.
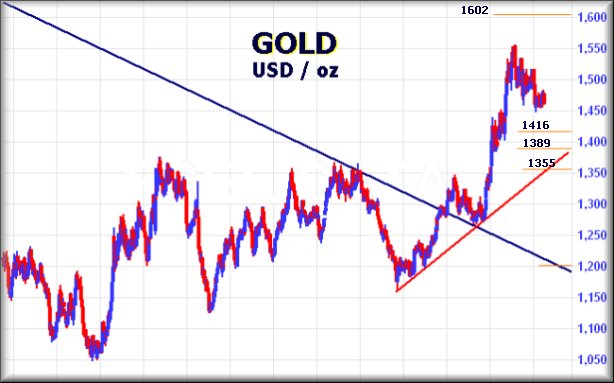
Gold was last reviewed 3 weeks ago and little has changed. Overall, we
still suspect it intends 1602 dollars on the current cycle, once some immediate
amateur dramatics complete. It continues to appear the price of Gold intends
some near term weakness with the result travel now below 1440 calculates with
1416 as a point at which we’d hope for a rebound. If broken, the price almost
must bounce at 1389 dollars.
What interests us from these drop potentials is a simple question. If Gold
does indeed reverse, will the price achieving 1416 happen around the same time
the DAX (for instance) reaches 13,489 points. Such a correlation of markets
would prove fascinating with one suggesting a Short position (and crossed
fingers) while the other will want a Long position (and a lucky rabbits foot).
#DAX #Brent A regular complaint relates to the quantity of media market “experts” queuing up for interviews with prophecies about the end of the world being nigh. In the media, where quantity has no relationship to quality, we thought it perhaps an idea to examine some world markets, trying to define areas where some hesitation appears probable.
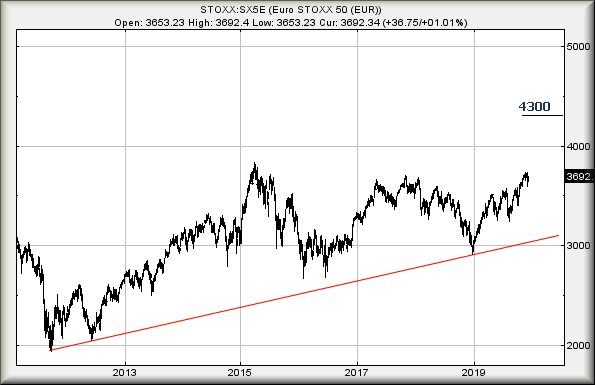
Staying close to home, the Euro Stocks 50
(presently trading around 3,690 points, is presently flirting with something we
call a “stutter level”, a point at which a glass ceiling will often form. In the
case of the EU50, this problem level has been evident since 2017 at 3,685 points
and is finally starting to show some sign of hopefully breaking free and move
upward. If our thoughts on this scenario are correct, movement now above 3,732
points calculates with an initial ambition at 3,975 points. Only with closure
above such a level dare we mention “top” should prove to be around the 4,300
level. Certainly, we’re should this point as an ideal number to try a short with
a fairly tight stop at 4,325 if gullible or 4,400 if sane. If historical
experience is anything to go by, reversal could see a journey to the 3,000 point
level!
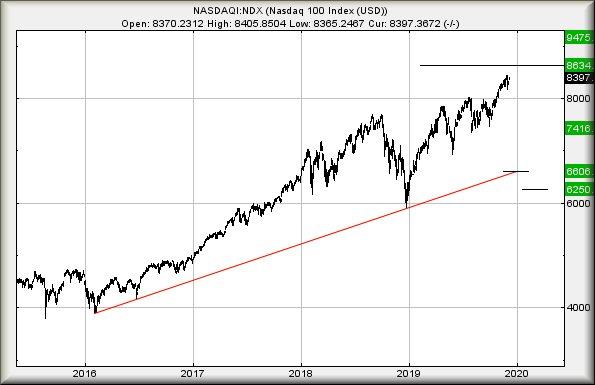
The Nasdaq – or US Tech 100 – is presenting an
interesting scenario. We’ve a strong argument which favours something traumatic,
should the market achieve 8,634 points. While we can calculate a secondary at
9,475 points, we suspect real life shall intrude, especially as the market is
already pretty close to our 8,634 target already. Anything now beyond 8,450
looks capable of reaching this level.
The US Market is always quite prescient when
approaching major target levels, thankfully often showing a willingness to
bypass them by simply gapping the index upward at the open repeatedly. If a
cunning plan is to be enacted, it shall be worth watching for these gaps
appearing anytime now!
We’re intending spend this week running the numbers
against various world indices.