#FTSE for FRIDAY and something about candle patterns. #Gold #US500 The last few days have been fairly noteworthy. Our long mooted 7360 finally made an appearance, even managing to pause at the level and thankfully confirm we’ve been watching the correct movement table.
And then… it broke on Thursday afternoon.
There’s a fairly major issue with this set of circumstances but from a near term perspective, the threat now is of weakness below 7304 generating some travel to an initial 7286 points. If broken, our secondary calculates at 7226 points.
However, there’s a reasonable argument which suggests the FTSE (always remember, we are discussing the index, not FTSE Futures before 8am) should bounce at the 7304 level. If this proves the case, any rebound bettering 7344 points is supposed to reach an initial 7383 points. If this level is bettered, our secondary calculates at 7416 points.

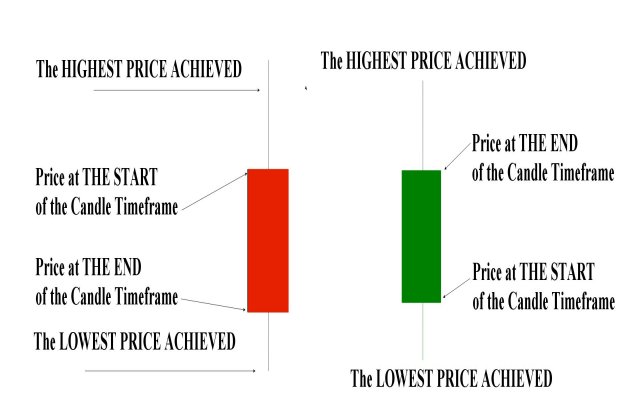
Finally, a lot of nonsense is devoted to the voodoo science of candle patterns. It’s all rubbish! The image below explains the very simple logic employed in producing a candle. Whether it is a 1 Month, 1 Day, 1 Hour, or 1 Minute candle this methodology is employed.
On the left, a RED (Down) Candle and on the right, a GREEN (Up) Candle. The only thing differentiating the two is what happened to a price within whatever timeframe it represents. The rest is boring common sense…
Have a good weekend.
| Time Issued | Market | Price At Issue | Short Entry | Fast Exit | Slow Exit | Stop | Long Entry | Fast Exit | Slow Exit | Stop | Prior | |
| 9:50:25PM | BRENT | 76.53 | ‘cess | |||||||||
| 9:52:12PM | GOLD | 1200.22 | 1195 | 1190.5 | 1185 | 1204 | 1207 | 1210.95 | 1218 | 1196 | Success | |
| 9:56:04PM | FTSE | 7337.73 | ‘cess | |||||||||
| 9:58:33PM | FRANCE | 5263.5 | ‘cess | |||||||||
| 10:01:01PM | GERMANY | 11981 | ‘cess | |||||||||
| 10:02:58PM | US500 | 2877.77 | 2867 | 2860.5 | 2842 | 2884 | 2894 | 2904.5 | 2917 | 2876 | ‘cess | |
| 10:05:50PM | DOW | 25995.4 | ‘cess | |||||||||
| 10:08:21PM | NASDAQ | 7451.5 | Success | |||||||||
| 10:10:45PM | JAPAN | 22382 | ‘cess |