#FTSE #Nasdaq #Barclays are presently giving sufficient excuse for us to explain a reason for market paranoia. What we’re seeing is the exact opposite of what’s usually an a reason for optimism, when a price reacts to a downtrend from afar. This seductive dance is something we often suspect is designed to panic traders, convincing them a share isn’t about to go up.
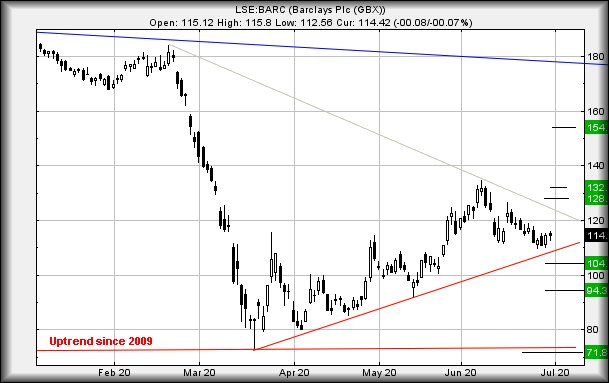
Barclays neat trick is doing the converse, the price spending the last 4 sessions floating just above the immediate uptrend (circled). Anyone drawing an uptrend since the March Covid-19 low will quickly note the share hasn’t broken the uptrend and visually, hopefully it shall not. In fact, some folk will convince themselves this makes a safe entry point and thus, convince themselves it’s safe to enter a position which may be a trap! Like all traps, the trigger movement is liable to be fast and painful.
The situation immediately now threatens weakness below 109p leading to an initial 104p with secondary, if broken, calculating at 94p and hopefully a solid bounce. The great danger comes should 94p break, whether due to news flow or world events. In such a scenario, the price could easily accelerate downhill toward 71p and hopefully a proper bottom.
Of course, there’s the obvious risk we’re focussing on reversal potentials, simply due to the feeling of gloom inflicted on everyone by the pandemic. Thankfully, the share price does not require much work to suggest some optimism may be possible. There’s a fairly useless immediate potential, where movements above 116p are supposed to propel Barclays toward 120.5p. Should the 120.5p be exceeded, a small box gets ticked which gives the first signal a bounce may be genuine. Above 120.5p should trigger further recovery toward an initial 128p with secondary, if exceeded, at 132p along with a very probable glass ceiling, given this matches the level of previous highs.
Only with closure above 132p dare we believe a miracle toward 154p and beyond is coming.
For the moment, Barclays share price is in the “crossed fingers” zone where we suspect the worst while hoping for the best.

FUTURES
| Time Issued | Market | Price At Issue | Short Entry | Fast Exit | Slow Exit | Stop | Long Entry | Fast Exit | Slow Exit | Stop | Prior |
| 9:28:24PM | BRENT | 41.35 | |||||||||
| 9:30:56PM | GOLD | 1781.97 | ‘cess | ||||||||
| 9:38:40PM | FTSE | 6183 | |||||||||
| 9:40:28PM | FRANCE | 4955.7 | 4899 | 4880.5 | 4848 | 4943 | 4975 | 4996.5 | 5029 | 4923 | |
| 9:43:49PM | GERMANY | 12356 | ‘cess | ||||||||
| 9:45:48PM | US500 | 3095.07 | Success | ||||||||
| 9:50:22PM | DOW | 25789 | ‘cess | ||||||||
| 9:52:32PM | NASDAQ | 10156 | 10048 | 10000 | 9939 | 10115 | 10182 | 10253 | 10326 | 10084 | Success |
| 9:54:32PM | JAPAN | 22335 |
30/06/2020 FTSE Closed at 6169 points. Change of -1.15%. Total value traded through LSE was: £ 5,315,656,653 a change of 10.43%
29/06/2020 FTSE Closed at 6241 points. Change of 1.33%. Total value traded through LSE was: £ 4,813,785,764 a change of 2.33%
26/06/2020 FTSE Closed at 6159 points. Change of 0.2%. Total value traded through LSE was: £ 4,704,232,985 a change of 0.38%
25/06/2020 FTSE Closed at 6147 points. Change of 0.39%. Total value traded through LSE was: £ 4,686,605,937 a change of -15.87%
24/06/2020 FTSE Closed at 6123 points. Change of -3.12%. Total value traded through LSE was: £ 5,570,618,425 a change of 6.1%
23/06/2020 FTSE Closed at 6320 points. Change of 1.22%. Total value traded through LSE was: £ 5,250,584,442 a change of -0.97%
22/06/2020 FTSE Closed at 6244 points. Change of -0.76%. Total value traded through LSE was: £ 5,301,930,883 a change of -54.04%