#Gold #SP500 Presumably DFS are now spending fortunes advertising their product as the years of lockdown must surely have worn out sofa’s everywhere. We’re probably facing the year when we decide to stop paying for a TV licence, rarely watching the commercial TV channels and we’ve long run out of patience with the BBC and their inability to provide impartial reporting, even locally in the UK. Instead Netflix has become the weapon of choice with occasional jumps into Youtube but we feel deprived, missing the constant bombardment of commercial television spending most of its time trying to sincerely convince viewers of the benefit of watching commercial TV.
All joking aside, it must be difficult nowadays for the likes of DFS trying to get the message across about their presumably excellent range of furniture. In our home, we don’t buy daily newspapers but will invest in Private Eye and the occasional Friday edition of the FT. Neither publication is the sort of place where a two page advert extolling the virtues of a suite will find a natural home and, in any case, we wonder how well companies are going with extortionate interest rates doubtless making their usual “easy payment terms” less attractive.
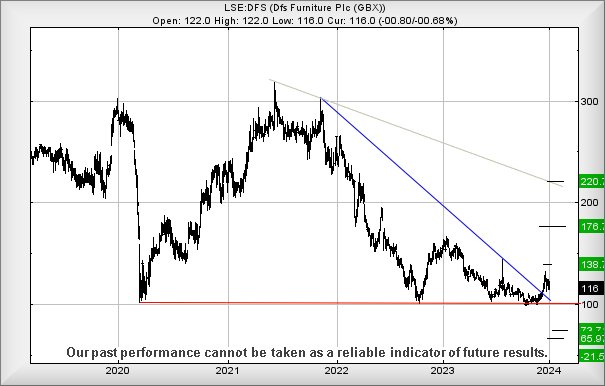
However, we’ve had a couple of emails asking our opinion against DFS and there’s certainly something which immediately caught our eye.
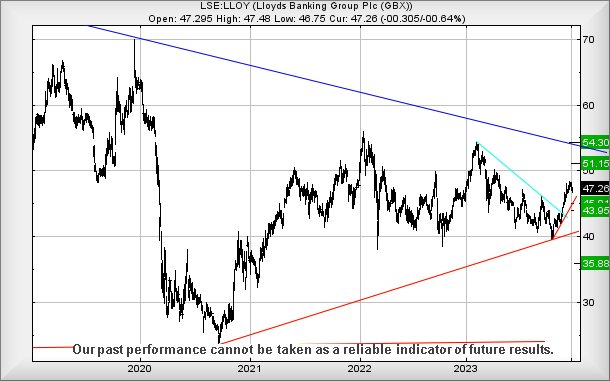
Visually, the market appears to have decided the 100p level should be regarded as a solid floor (there’s no such thing) and now, we should be excitedly counting the days until this share price suddenly opts to head upward. It’s the case where we can present a scenario with movement above 125p apparently being capable of triggering recovery to an initial 138p. I bettered, our longer term secondary calculates at 176p, an ambition which is visually believable.
Our alternate scenario suggests any weakness below 100p should trigger reversals down to an initial 74p with secondary, if broken, at 65p. The proximity of both target levels tends strongly suggest the potential for a bounce, if a drop takes place.
FUTURES
| Time Issued | Market | Price At Issue | Short Entry | Fast Exit | Slow Exit | Stop | Long Entry | Fast Exit | Slow Exit | Stop | Prior |
| 10:43:00PM | BRENT | 7619 | |||||||||
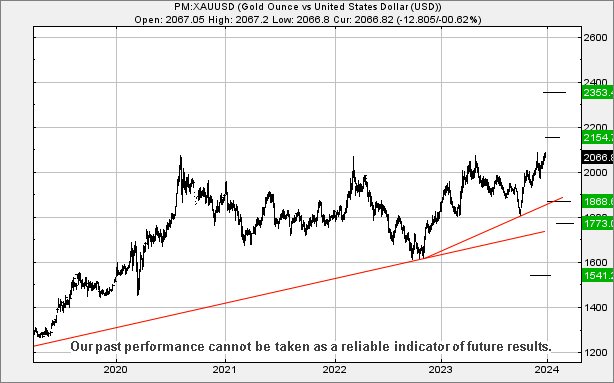
| 10:46:00PM | GOLD | 2027.71 | 2017 | 2005 | 1985 | 2037 | 2052 | 2062 | 2077 | 2026 | |
| 10:50:12PM | FTSE | 7711.9 | |||||||||
| 10:52:42PM | STOX50 | 4497.4 | |||||||||
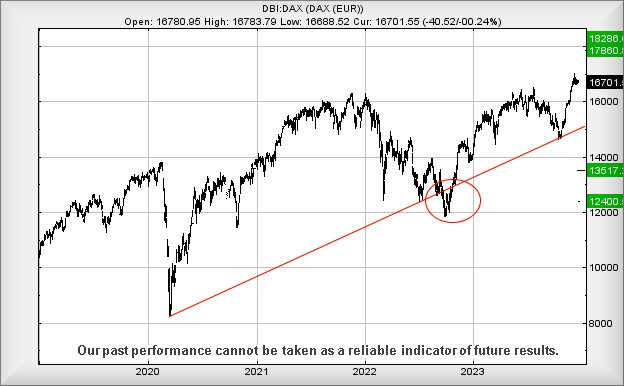
| 10:55:48PM | GERMANY | 16764.6 | ‘cess | ||||||||
| 10:59:27PM | US500 | 4760.1 | 4723 | 4715 | 4698 | 4739 | 4766 | 4785 | 4826 | 4750 | Success |
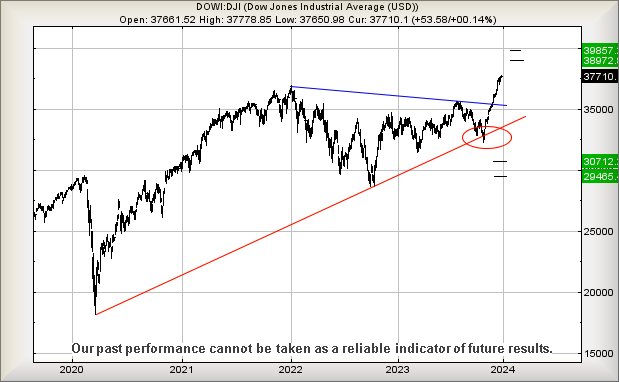
| 11:02:43PM | DOW | 37637 | ‘cess | ||||||||
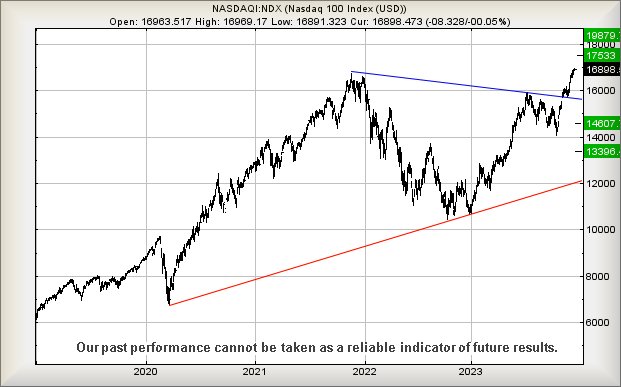
| 11:05:02PM | NASDAQ | 16625.4 | |||||||||
| 11:15:32PM | JAPAN | 33815 |
8/01/2024 FTSE Closed at 7694 points. Change of 0.07%. Total value traded through LSE was: £ 4,692,765,125 a change of -13.08%
7/01/2024 FTSE Closed at 7689 points. Change of -0.44%. Total value traded through LSE was: £ 5,398,845,060 a change of 19.89%
4/01/2024 FTSE Closed at 7723 points. Change of 0.53%. Total value traded through LSE was: £ 4,502,996,889 a change of -2.05%
3/01/2024 FTSE Closed at 7682 points. Change of -0.52%. Total value traded through LSE was: £ 4,597,057,566 a change of 72.6%
28/12/2023 FTSE Closed at 7722 points. Change of -100%. Total value traded through LSE was: £ 2,663,363,582 a change of 0%
27/12/2023 FTSE Closed at 7724 points. Change of 0%. Total value traded through LSE was: £ 3,580,231,157 a change of 0%
SUCCESS above means both FAST & SLOW targets were met. ‘CESS means just the FAST target met and probably the next time it is exceeded, movement to the SLOW target shall commence.
Our commentary is in two sections. Immediately below are today’s updated comments. If our commentary remains valid, the share can be found in the bottom section which has a RED heading. Hopefully, this will mean you no longer need to flip back through previous reports. HYPERLINKS DISABLED IN THIS VERSION
Please remember, all prices are mid-price (halfway between the Buy and Sell). When we refer to a price CLOSING above a specific level, we are viewing the point where we can regard a trend as changing. Otherwise, we are simply speculating on near term trading targets. Our website is www.trendsandtargets.com.
UPDATE. We often give an initial and a secondary price. If the initial is exceeded, we still expect it to fall back but the next time the initial is bettered, the price should continue to the secondary. The converse it true with price drops.
We can be contacted at info@trendsandtargets.com. Spam filters set to maximum so only legit emails get through…
Section One – Outlook Updated Today. Click here for Section Two – Outlook Remains Valid shares
Click Epic to jump to share: LSE:HIK Hikma** **LSE:IGG IG Group** **LSE:MKS Marks and Spencer** **LSE:SBRY Sainsbury** **
********
Updated charts published on : Hikma, IG Group, Marks and Spencer, Sainsbury,
LSE:HIK Hikma. Close Mid-Price: 1862 Percentage Change: + 0.16% Day High: 1862 Day Low: 1843
In the event of Hikma enjoying further trades beyond 1862, the share shou ……..
</p
View Previous Hikma & Big Picture ***
LSE:IGG IG Group. Close Mid-Price: 764.5 Percentage Change: + 1.73% Day High: 773.5 Day Low: 759.5
Further movement against IG Group ABOVE 773.5 should improve acceleration ……..
</p
View Previous IG Group & Big Picture ***
LSE:MKS Marks and Spencer. Close Mid-Price: 290.5 Percentage Change: + 2.22% Day High: 290.7 Day Low: 280.7
Further movement against Marks and Spencer ABOVE 290.7 should improve acc ……..
</p
View Previous Marks and Spencer & Big Picture ***
LSE:SBRY Sainsbury. Close Mid-Price: 310.4 Percentage Change: + 0.45% Day High: 310.6 Day Low: 305.7
Target met. In the event of Sainsbury enjoying further trades beyond 310. ……..
</p
View Previous Sainsbury & Big Picture ***