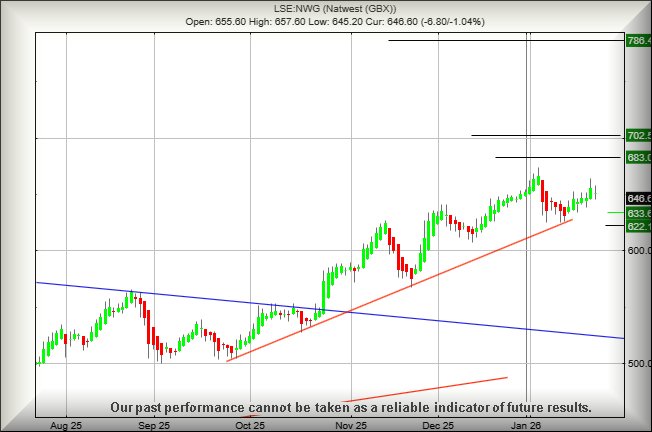
#Brent #WallSt Three weeks ago, we presented an amazingly accurate article about Barclays. Unfortunately, it was only amazing to ourselves as absolutely none of the predictions triggered, Barclays share price remaining delicately below our 493p trigger level as the value virtually flatlined for three weeks. Perhaps the UK central bank shall provide excuse for movement this Thursday but we’re starting to have doubts, due to the recent damaging lack of movement from the US Fed Reserve. Traditionally, the Bank of England embraces any excuse to avoid doing anything to benefit the country, unquestioned by complicit UK politicians.
If we were to bundle together our favourite hobbyhorses, Interest Rate manipulation would be high, closely followed by political incompetence. Though perhaps the weather here in Argyll deserves a serious rank, if only due to the absolute inability of ANY forecasting service to guess what’s really going to happen. All it ever does is rain a lot, except when it is freezing. And sometimes, it’s rather windy too.
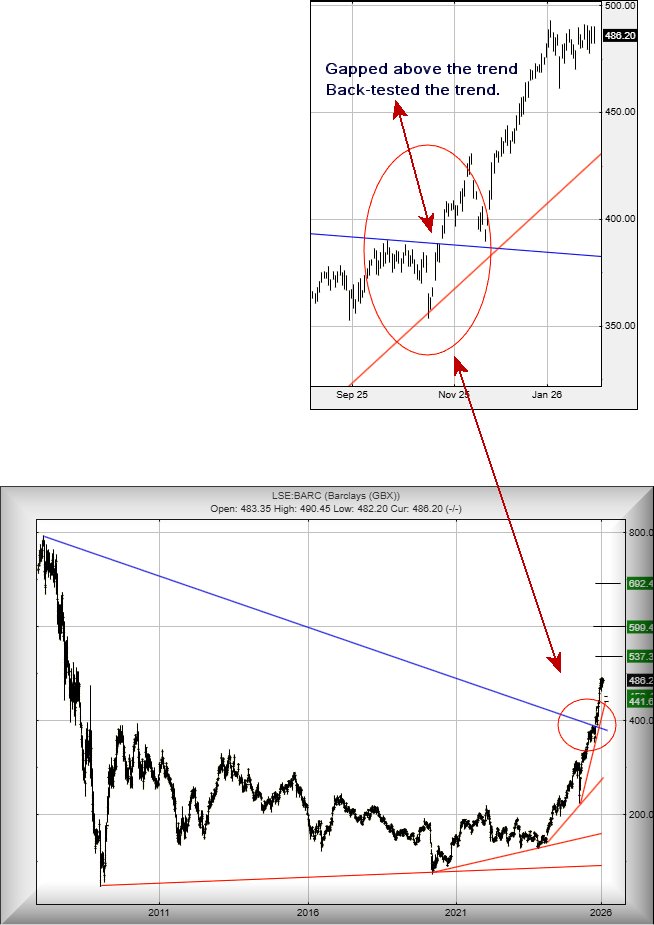
However, it’s worth – we think – paying attention to a pretty strong signal exhibited by Barclays, shown on the zoomed in chart extract below. Last year in October, the market opted to Gap Barclays share price above a Blue downtrend. This line from 2007 clearly has inherited some gravitas, the market not only moving the share price above the trend but giving it a little kiss to “back-test the trend” a month later. Quite why this ritual was completed utterly defeats us, especially due to our solid belief Barclays share price now needs close below 389p, the level of trend break, to deserve any real excuse for panic.
It is now the case where, from a Big Picture perspective, we can ask Barclays to trade above 505p to trigger happy days coming, currently calculating with the potential of gains to an initial 537p with our secondary, if beaten, at 599p and some potential hesitation. But overall, share price closure above 505p shall permit us to dream of a future 692p as exerting as much influence as Epstein’s emails are sprinkling across the moral compass of some of the rich and famous.
Should things intend go a little bit wrong, below 468 suggests imminent reversals to an initial 452p with our secondary, if broken, at 441p and a potential bounce.
In the case of Barclays, we suspect our reversal scenario shall be favoured.
FUTURES
FUTURES
| Time Issued | Market | Price At Issue | Short Entry | Fast Exit | Slow Exit | Stop | Long Entry | Fast Exit | Slow Exit | Stop |
| 10:38:34PM | BRENT | 6975.1 | 6611 | 6502 | 6319 | 6750 | 6858 | 6966 | 7327 | 6763 |
| 10:41:27PM | GOLD | 4777 | ||||||||
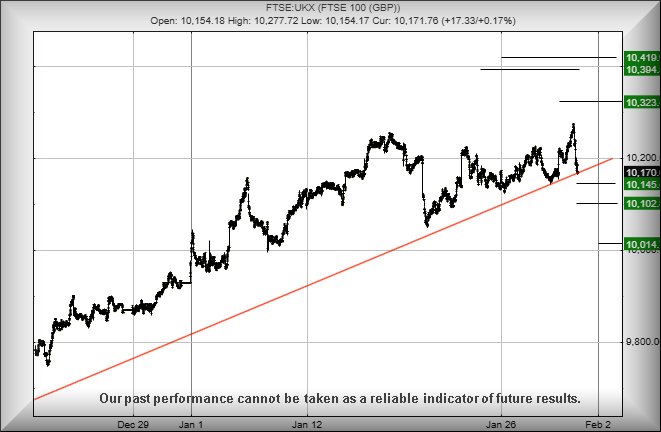
| 10:43:37PM | FTSE | 10214 | ||||||||
| 10:48:20PM | STOX50 | 5921.1 | ||||||||
| 10:50:40PM | GERMANY | 24471.3 | ||||||||
| 10:55:40PM | US500 | 6923 | 6892 | 6868 | 6836 | 6920 | 6964 | 6972 | 6999 | 6914 |
| 10:58:52PM | DOW | 48854.5 | ||||||||
| 11:02:17PM | NASDAQ | 25421.6 | ||||||||
| 11:04:59PM | JAPAN | 53307 |
30/01/2026 FTSE Closed at 10223 points. Change of 0.51%. Total value traded through LSE was: £ 7,420,952,174 a change of -6.19%
29/01/2026 FTSE Closed at 10171 points. Change of 0.17%. Total value traded through LSE was: £ 7,910,853,503 a change of 7.47%
28/01/2026 FTSE Closed at 10154 points. Change of -0.52%. Total value traded through LSE was: £ 7,361,268,388 a change of 11.9%
27/01/2026 FTSE Closed at 10207 points. Change of 0.58%. Total value traded through LSE was: £ 6,578,616,321 a change of 11.32%
26/01/2026 FTSE Closed at 10148 points. Change of 0.05%. Total value traded through LSE was: £ 5,909,471,540 a change of -3.4%
23/01/2026 FTSE Closed at 10143 points. Change of -0.07%. Total value traded through LSE was: £ 6,117,563,035 a change of -17.66%
22/01/2026 FTSE Closed at 10150 points. Change of 0.12%. Total value traded through LSE was: £ 7,429,608,745 a change of -10.7% 
SUCCESS above means both FAST & SLOW targets were met. ‘CESS means just the FAST target met and probably the next time it is exceeded, movement to the SLOW target shall commence.
Our commentary is in two sections. Immediately below are today’s updated comments. If our commentary remains valid, the share can be found in the bottom section which has a RED heading. Hopefully, this will mean you no longer need to flip back through previous reports. HYPERLINKS DISABLED IN THIS VERSION
Please remember, all prices are mid-price (halfway between the Buy and Sell). When we refer to a price CLOSING above a specific level, we are viewing the point where we can regard a trend as changing. Otherwise, we are simply speculating on near term trading targets. Our website is www.trendsandtargets.com.
UPDATE. We often give an initial and a secondary price. If the initial is exceeded, we still expect it to fall back but the next time the initial is bettered, the price should continue to the secondary. The converse it true with price drops.
We can be contacted at info@trendsandtargets.com. Spam filters set to maximum so only legit emails get through…
Section One – Outlook Updated Today. Click here for Section Two – Outlook Remains Valid shares
Click Epic to jump to share: LSE:CNA Centrica** **LSE:ECO ECO (Atlantic) O & G** **LSE:FRES Fresnillo** **LSE:ITM ITM Power** **LSE:LLOY Lloyds Grp.** **LSE:NG. National Glib** **LSE:SAGA SAGA Plc** **
********
Updated charts published on : Centrica, ECO (Atlantic) O & G, Fresnillo, ITM Power, Lloyds Grp., National Glib, SAGA Plc,
LSE:CNA Centrica. Close Mid-Price: 190.95 Percentage Change: + 0.77% Day High: 192.6 Day Low: 189.2
In the event of Centrica enjoying further trades beyond 192.6, the share ……..
</p
View Previous Centrica & Big Picture ***
LSE:ECO ECO (Atlantic) O & G Close Mid-Price: 36.6 Percentage Change: -1.08% Day High: 38.75 Day Low: 37
Continued trades against ECO with a mid-price ABOVE 38.75 should improve ……..
</p
View Previous ECO (Atlantic) O & G & Big Picture ***
LSE:FRES Fresnillo Close Mid-Price: 3702 Percentage Change: -5.08% Day High: 3794 Day Low: 3582
If Fresnillo experiences continued weakness below 3582, it will invariabl ……..
</p
View Previous Fresnillo & Big Picture ***
LSE:ITM ITM Power Close Mid-Price: 62.3 Percentage Change: -1.11% Day High: 65.5 Day Low: 60.4
Weakness on ITM Power below 60.4 will invariably lead to 55 with our seco ……..
</p
View Previous ITM Power & Big Picture ***
LSE:LLOY Lloyds Grp.. Close Mid-Price: 108.95 Percentage Change: + 3.32% Day High: 108.7 Day Low: 105.7
Continued trades against LLOY with a mid-price ABOVE 108.7 should improve ……..
</p
View Previous Lloyds Grp. & Big Picture ***
LSE:NG. National Glib. Close Mid-Price: 1234.5 Percentage Change: + 0.37% Day High: 1240 Day Low: 1223
Target met. All National Glib needs are mid-price trades ABOVE 1240 to im ……..
</p
View Previous National Glib & Big Picture ***
LSE:SAGA SAGA Plc. Close Mid-Price: 520 Percentage Change: + 4.00% Day High: 524 Day Low: 496.5
Target met. In the event of SAGA Plc enjoying further trades beyond 524, ……..
</p
View Previous SAGA Plc & Big Picture ***