Hurricane Energy #gold There comes a point in everyone’s life, a “you know you’re a grownup…” moment, which just feels ageing. Experiencing this today, automatically filling the salt shaker over the kitchen sink, gave a moment of self disgust. Forever gone was the crunch of spilled salt on a worktop, along with a withering look.
I often wonder if traders experience these lucid
moments of common sense, when chasing a share price’, realising they dodged a
bullet by opting to do something different. Popular share, Hurricane Energy, is
approaching a point where folk may need question its future potentials.
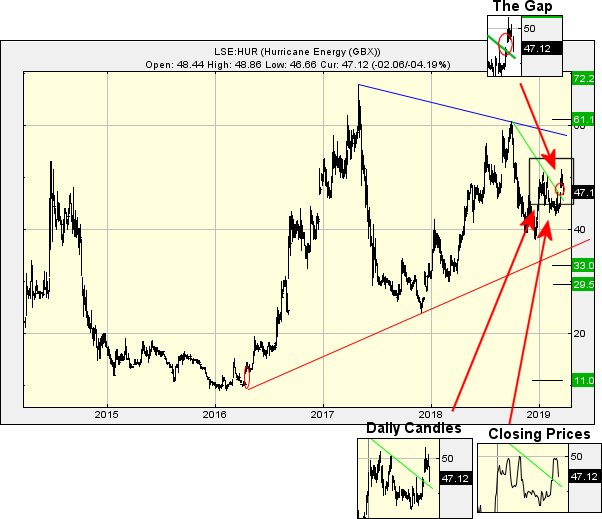
The inset on the chart is being used to justify our
doze of nerves. More often than we’d like, shares are promoted upward above a
downtrend, giving an impression of good times ahead. Unfortunately, this
impression will be dashed a few days later with the price forced below the
downtrend again. We’ve adopted the term GaGa for this nonsense, Gap Up, Gap
Down. As the inset shows, in the event Hurricane is gapped below that Green line
anytime soon (presently 45.5) it will complete a perfect GaGa dance, moving the
price into a region where we’d expect it to relax to 33p eventually. Secondary,
if broken, is a bottom of 29p, this being a point where it almost must bounce.
Of course, we’re speculating on a movement which hasn’t
yet happened but it is, without doubt, something to be aware of. Somehow or
other, the market uses the strength in these GaGa things to generate sufficient
weakness for severe drops.
Importantly, we’ve another inset worth discussion,
again something fairly important. For some reason, the market has gone to
exquisite lengths to avoid this share price actually closing above
the 50p mark. It results in speculation this price is liable to prove quite
interesting – if the market ever permits the share to actually close a session
above 50p. Such a triggering move would suggest coming growth to an initial 61p.
If exceeded, secondary is a longer term 72p, displaying a new all time high,
preparing the share price for a strong future.
For now though, we’re worried about a “surprise” Gap
Down appearing, taking the price below that Green trend line.
BRENT CRUDE Big Picture. We’d friends round for dinner on Saturday. Okay, we had Chinese takeaway containers on the table,
plates, cutlery, several bags of chips, and the
inevitable bag of prawn crackers for the animals. And wine, lots of wine. Mrs T&T, despite proper chef credentials, likes
relaxing with friends rather than cooking for ’em.
During the course of the evening, it became clear there was an almost
ridiculous notion the market analyst in the room would know, with complete
certainty, what was going to happen in the future as a result of Brexit. The
shock, when it was admitted I don’t have a clue, should not have been a
surprise. But at present, there are many indications of share prices being
placed in fairly tight ranges until the current chaos – if it is chaos – can be
resolved. Personally speaking, it’s difficult to trust anything written or
broadcast, thanks to the level of agenda’ being promoted.
During the last week, there has been further evidence of share prices being
stalled into a range with some interesting movements against the retail banks.
Surprisingly, even Brent Crude (an international benchmark price) seems to be
showing the potential of it being trapped for a while.
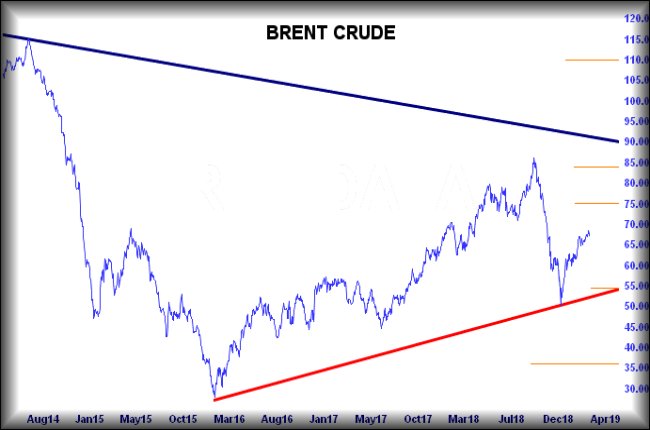
The immediate situation against Brent seems fairly simple.
Movement now above 69 should promote further growth to an initial 75. If
exceeded, secondary is at 84 dollars. Visually, neither ambition is particularly
helpful as it appears the market intends match the high of last year but
certainly, no higher without some volatility first. More probable, if our
suspicion about “parking” proves correct, shall be weakness now below 64 proving
capable of reversal toward 55 and a bonk against the uptrend since 2015. A more
severe (but visually unlikely) issue occurs, should the price manage below the
RED uptrend as future weakness to 35 becomes possible.
For now, we favour the visuals which tend suggest a repeat of last years
performance shall prove viable. As a result, it will hopefully be worth watching
for similar dance steps enacted by oil related share prices.
FTSE for FRIDAY #Nasdaq #Brent The UK market continues to power itself upward, lifted by what? We bang on about how important “Higher Highs” can be, a notion amply proved by market moves since March 17th. Once a market starts growing, it becomes difficult to slow things down, despite an entire political class’ best efforts.
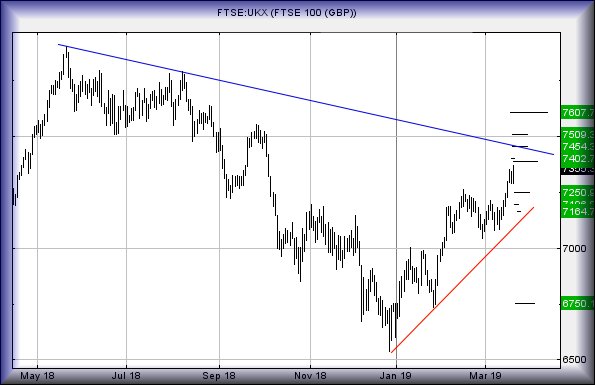
The immediate situation for the FTSE is slightly
confusing. Generally when a “Higher High” cycle commences, the market will only
grow so far before some doubt establishes, provoking a reversal to the point it
all started. In the case of the FTSE, this means we should not be aghast to
witness travel to around 7250 in the days ahead. Prior to this, we’d hope
anything near term above 7371 should bring some oomph for an initial 7386
points. If bettered, secondary is at 7402 points and an ideal level from which
relaxation can be expected. This sort of ambition comes nowhere close to
bothering the BLUE downtrend, thus giving the impression hope remains for the
longer term.
Unfortunately, if taking our rhetoric as gospel, the
index could continue to 7454 should 7402 be exceeded, so that’s a reasonable
level to try a stop loss at. Our suspicion, should Brexit be delayed, is of
reversal to 7250 prior to an attempt at BLUE on the chart.
All of this is, of course, completely insane!
We’re the first to admit it as there’s something going
on which software alone cannot account for. When a market makes a Higher High,
it’s almost unheard of for a price to accelerate to target without deflection.
Instead, a price will generally make it around half way to a primary target and
then, doubt establishes itself amongst traders. A sell off to collect profit
thus will generally fuel a reversal down to whatever prior level it started
from. Now, smart traders (in the absence of negative news) will again buy into a
market, hoping for a bounce with the next surge upward hopefully exceeded the
previous half way mark.
Simple? Or just human nature?
The FTSE complicates things as we’re showing a strange
tier of target levels, a collection of 100 point leaps from 7402 through 7500
all the way to 7600. At present, the important detail comes if 7402 exceeded as
continued traffic to 7509 is theoretically possible. We do expect that BLUE line
to have a say in matters though.
At present, we’re not inclined to take any reversal as
serious unless the FTSE stumbles below the 7300 level before attempting our
immediate 7386 target. This risks being a poor show, possibly the harbinger of
coming weakness to 7196 and below to a bottom of 7164 points.
Finally, have a good weekend and “Hello again” to our
regular readers on Reunion Island, along with new visitors from Antigua and
Barbuda (you’re all lucky people!)
21/03/2019 FTSE Closed at 7355 points. Change of 0.88%. Total value traded through LSE was: £ 5,645,172,640 a change of -16.41%
FTSE for FRIDAY (FTSE:UKX)
The UK market continues to power itself upward, lifted by
what? We bang on about how important “Higher Highs” can be, a notion amply
proved by market moves since March 17th. Once a market starts growing, it
becomes difficult to slow things down, despite an entire political class’ best
efforts.
The immediate situation for the FTSE is slightly
confusing. Generally when a “Higher High” cycle commences, the market will only
grow so far before some doubt establishes, provoking a reversal to the point it
all started. In the case of the FTSE, this means we should not be aghast to
witness travel to around 7250 in the days ahead. Prior to this, we’d hope
anything near term above 7371 should bring some oomph for an initial 7386
points. If bettered, secondary is at 7402 points and an ideal level from which
relaxation can be expected. This sort of ambition comes nowhere close to
bothering the BLUE downtrend, thus giving the impression hope remains for the
longer term.
Unfortunately, if taking our rhetoric as gospel, the
index could continue to 7454 should 7402 be exceeded, so that’s a reasonable
level to try a stop loss at. Our suspicion, should Brexit be delayed, is of
reversal to 7250 prior to an attempt at BLUE on the chart.
All of this is, of course, completely insane!
We’re the first to admit it as there’s something going
on which software alone cannot account for. When a market makes a Higher High,
it’s almost unheard of for a price to accelerate to target without deflection.
Instead, a price will generally make it around half way to a primary target and
then, doubt establishes itself amongst traders. A sell off to collect profit
thus will generally fuel a reversal down to whatever prior level it started
from. Now, smart traders (in the absence of negative news) will again buy into a
market, hoping for a bounce with the next surge upward hopefully exceeded the
previous half way mark.
Simple? Or just human nature?
The FTSE complicates things as we’re showing a strange
tier of target levels, a collection of 100 point leaps from 7402 through 7500
all the way to 7600. At present, the important detail comes if 7402 exceeded as
continued traffic to 7509 is theoretically possible. We do expect that BLUE line
to have a say in matters though.
At present, we’re not inclined to take any reversal as
serious unless the FTSE stumbles below the 7300 level before attempting our
immediate 7386 target. This risks being a poor show, possibly the harbinger of
coming weakness to 7196 and below to a bottom of 7164 points.
Finally, have a good weekend and “Hello again” to our
regular readers on Reunion Island, along with new visitors from Antigua and
Barbuda (you’re all lucky people!)
Lloyds Group #DOW #DAX
In the UK at present, two things appear certain. Neither
Lloyds share price, nor our competent parliament, can make a decision about the
future. While our national leaders embrace of indecision is well documented,
Lloyds Bank is less so.
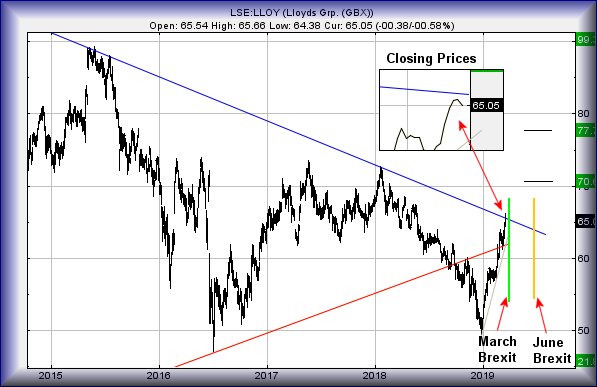
Last time we reviewed this, we gave a suspiciously
precise number which the share required actually close above to make recovery to
67.6p confident. At present, our ridiculous number is at roughly 65.332p and the
share price is making efforts to avoid closing a session above this point. As
the inset on the chart shows, some quite silly acrobatics are taking place to
avoid closure above BLUE. If nothing else, it tends confirm we’ve been watching
the correct trend and therefore, closure beyond such a level should prove
capable of some reliable shuffles upward.
The ruling scenario suggests closure beyond 65.33 shall
make growth to an initial 70.6p fairly confident. Secondary, if bettered, is a
longer term (or next day) 77.7p. We quite like the visuals surrounding the 77p
level, due to some prior history around this point.
For now, we have our doubts, suspecting Lloyds shall
once again be shoved back in its box. On the chart, we’ve painted the present
Brexit date (next week) and in Gold, the next proposed Brexit date at the end of
June. This creates a scenario where Lloyds risks proving trapped for a while
longer with the June Brexit share price date sitting at 63.8p as a maximum. If
we’d to guess, it seems possible for Lloyds to oscillate between the 57 and 64
level until June, when doubtless everything shall again be in a state of flux.
Sorry if this sounds confusing but we’re confounded
with overall market behaviour.
Micron Tech. #Nasdaq #CAC40 We enjoy
glancing at oddballs, if only to prove we pay attention to readers emails. To be
honest though, what prompted interest was simultaneously seeing the company name
on a memory chip which was laying around on my desk, awaiting its chance to
breathe new life into a PC.
It will surprise readers we’re not early adopters of technology, quite the
converse. An in-house mantra of “if it ain’t broke, don’t fix it” had ensured
all our systems were 32bit, operating with 4gb ram***, but running Windows 10.
The purchase of a new laptop exhibited how Windows 10 could run if on a 64bit
system with 16gb of ram, along with a solid state hard drive. In the period
since, our desktop PC’s operating systems have changed to 64bit, their memory
substantially upgraded, and we’ve got super fast hard disks.
Unfortunately, a change to work practices was entailed. It used to be
standard to turn on the PC, then go make coffee. By the time a perfect Latte was
ready, the computer would generally be awake, ready for the day ahead. Now, each
upgraded PC takes around 15 seconds to boot. A residual feeling of lazy guilt
pervades, arriving at a machine which is now patiently waiting, the screensaver
displaying pictures of cats, dogs, and the occasional snow covered mountain
(better known as the view from the office!).
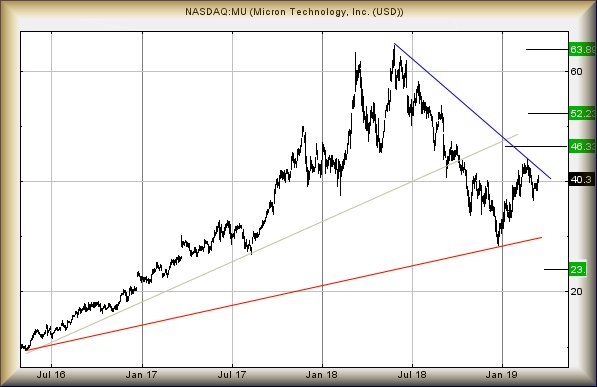
As for Micron Technology, their share price is showing some potentials. At
time of writing, it’s trading around 40.37 and need only exceed 42.32 to better
BLUE on the chart, the downtrend from May of last year. An event such as this
calculates with the potential of continued growth to an initial 46.33 and better
still, if exceeded it allows 52.23 to make a guest appearance as a potential
high.
Visually, the secondary ambition is interesting, matching a high from last
year. It looks very possible some sort of glass ceiling awaits, should our
calculation of 52.23 be met. In addition, it would make a longer term 63.8 a
viable target, meeting the shares all time high from last year!
For now, it appears worth watching in the days ahead. The price currently
requires trade below 33.25 to cause a loss of interest in its longer term
potentials.
*** 32bit operating systems can only access a maximum of 4gb memory,
regardless of how much is fitted to the machine.
Royal Bank of Scotland #Gold #DAX A truism about the climate here in Scotland is “if you don’t like the weather, wait a minute!” As our RBS report shows from just a month ago (link here), it appears something similar may be said about the banks share price… “If you don’t like it, just wait a while!”Continue reading “Trends and Targets for 19/03/2019”