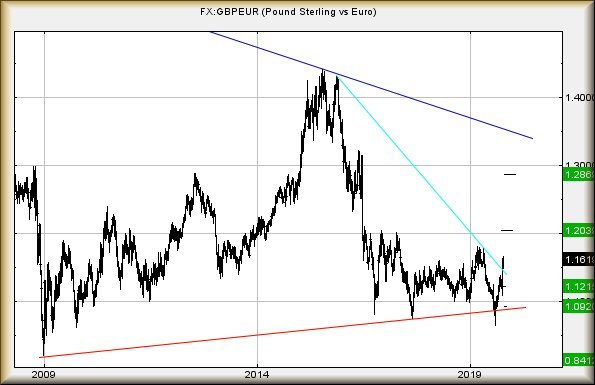
Brent DAX #GBPEUR feels like it should be a report at Easter! This currency pairing, for so long looking trapped in a dark cave, is actually starting to develop some recovery potentials. Perhaps Boris is doing a Mr Trump, ridiculed by media but regardless, appearing to do something right!
A key level has developed at 1.1688. This isn’t one of
our usual “higher high” things but instead, a calculated level above which it
‘should’ make travel toward 1.2039 difficult to avoid. In the event of the
market actually closing above this target level, a longer term 1.2869 computes
as possible.
It’s worth taking a step back and viewing the chart.
Historically, since 2016 this pairing has experienced issues at the 1.20 level.
For this reason, we’re suggesting only closure above 1.2039 is liable to
introduce the next big step in the pairings future. But it’s also worth
considering if the present Brexit hiatus continues, it’s very probable the
relationship will continue in a trading range between roughly 1.10 and 1.20.
For things to start going wrong, we would raise an
eyebrow if the pairing now weakens below 1.140 as this threatens reversal down
to an initial 1.1215. If broken, our secondary calculates at 1.0920. Visually,
this shall indicate a very firm return to being trapped in its “same old, same
old” trading range.
#FreeFutures Despite the FTSE index only being up 0.2%, it has been an extraordinary week for the market with surprising numbers of shares nudging above their growth triggers. Very few have reached their initial targets. Perhaps suggesting caution until news of a Brexit deal actually turns out to be real! Until then, just watch “The Good Place” on telly…
Even then, there risks being trouble on the horizon.
In a world already aflame with protest against
cack-handed government, Hong Kong protests invade our nightly news, protests on
Spain continued unabashed (unless including the bashing from the police), and of
course, French protests have become so commonplace, the media ignores them. In
the wings, the UK faces a problem with Scotland if the current agreement goes
ahead. Apparently it disadvantages the entire country, already agitating for
independence and voted nearly 2/3 against leaving the EU. While unrest from
Scotland feels unthinkable, nearly 4% of the population marched on Edinburgh in
foul conditions a few days ago in favour of independence. This massive turnout
was not widely covered by UK media, aside from an interesting analysis on the
BBC suggesting if more than 3.5% of a counties populace take to the streets,
their revolution will succeed.
Long story short, even if Westminster successfully
achieves some sort of Brexit agreement, it becomes highly unlikely we’ve seen
the end of this messy story as far as the UK is concerned.
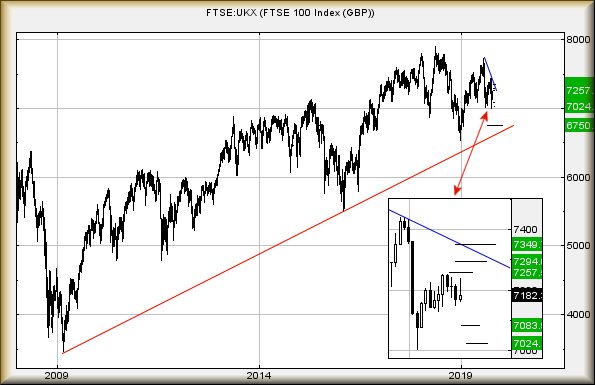
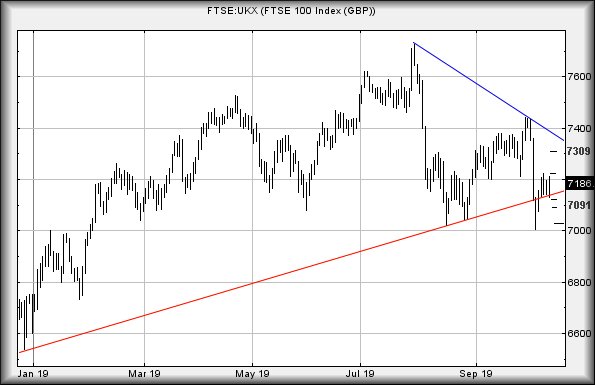
For Friday, the FTSE is in a fairly interesting
position. It closed Thursday at 7182 and needs exceed Thursday high of 7238
before we dare believe the FTSE is celebrating in earnest, showing the potential
of some real recovery. Near term, above 7242 indicates coming growth to an
initial 7257 points. If exceeded, secondary is a more useful 7294 points and a
level where some hesitation is expected. However, if the market opts to “go for
it”, we can mention a third level target at 7349 and this calculates as a
point where some volatility is expected. Interesting to note, it also intersects
with the downtrend since July.
As always, we’ve an “however” and alternate scenario.
The lowest the market has achieved in October has been 7004 points, this being a
concern. We had calculated a “bottom and bounce level” at 7034 points and the
index squirmed below. Thankfully, for those chasing a bounce, we’d also proposed
a stop loss around 6,990 points and the index has certainly provided payback.
But our 7034 did break, hinting at a risk of real
weakness if sufficient excuse discovered.
Now, below 7141 calculates as entering a cycle down to
an initial 7083 points. If broken, secondary calculates at 7024. This again
shall take the FTSE into the land of lower lows where an ill timed Tweet or
political quote could rapidly provoke reversal to 6750 points.
For now, we shall not be surprised to witness 7349
before everything unravels again.
#US500 #DOW Triggers are always interesting. Currently, Twitter has a constant battle about something called Transgender with the word “him” becoming a ‘trigger’ point for what is often quite nasty (aka entertaining) debate. Sensing a trough, politicians are even involved. Sooner or later, some innocent pastor is going to open the gates of hell on a Sunday, when asking his audience to rise for a singalong. Someone will complain; “It’s not a ‘HIM’, it’s a Psalm which now self identifies as Samantha…”
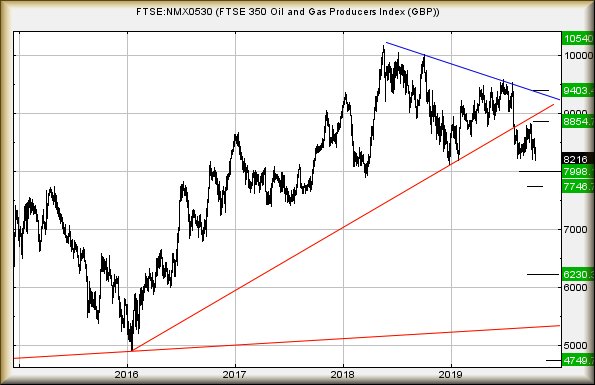
We had our own little “trigger” incident today with the
UK Oil & Gas Sector, the NMX0530!
Last time we covered it in August (link),
we’d warned the dangers if 8214 points broke. In the couple of months since, the
index has assiduously avoided the trigger level, almost teasing us with the care
taken to ensure 8214 points didn’t actually break. To us, it tends confirm we’ve
been working against the correct trend and calculating properly. Unfortunately,
for the index, it tends mean if we were correct about 8214, we’ll invariably be
correct about the reversal potentials.
The reason for our concern about this sector is fairly
obvious. Oil & Gas shares are fairly major drivers for the main index and also,
through the AIM, attractive to many private investors. As a result, we’d suggest
keeping a weather eye on the NMX0530 before decided any oil share is actually
cheap. The immediate situation is straightforward as weakness now below 8195
looks like entering a cycle down to 7998 points next. Visually, there is ample
reason to expect some sort of rebound at such a level but if it breaks on the
initial surge downhill, our secondary calculates at 7746 points.
From a really big picture perspective, if our secondary
fails to promote a reasonable rebound, the index risks losing a further 1500
points as it could trend down to a bottom (hopefully) at 6230 points.
To escape this potential Black Hole, the index requires
above 8570 points as this calculates with the potential of recovery to 8854
points. This “risks” being game changing, thanks to our secondary above 8854
coming in at 9403 points and safety (apparently) for the future.
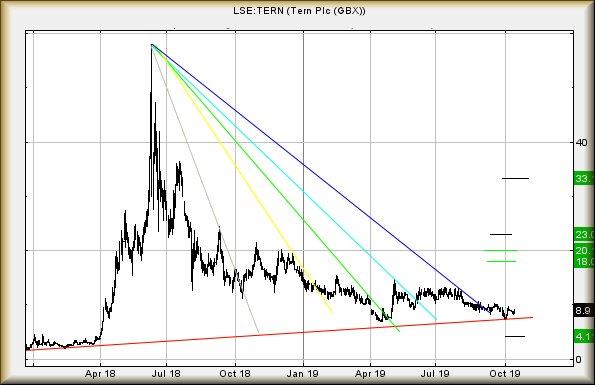
#DOW #FRANCE Tern is proving a bit of a puzzle. For the last few weeks, we’ve been anticipating it finding an excuse to bottom just above the 4p level. We’re starting to wonder if it’s a Brexit inspired share, something which promises to do something which never actually happens.
Thus far, the lowest achieved has been 7.65p and weakness below such a level
remains pointing at 4p but we’re having some doubts.
The reason for our hesitation comes from the plethora of coloured lines on
the chart. There appears little doubt TERN share price is simply ignoring prior
downtrends with the result something else must be driving the current period of
hiatus and we’d guess it isn’t chatroom gossip! Instead, it would be reasonable
to assume the market is patiently waiting for some sort of news, perhaps an
indication “The Internet of Things” is actually becoming a “thing”. Or perhaps
one of their investments is expected to come to fruition.
In the meantime, we’ll remain cautious, looking carefully at the glass
ceiling which has formed at 13.25p. Only movement above such a level is liable
to make us raise an eyebrow as this should trigger recovery to an initial 18p.
If exceeded on any initial surge, secondary calculates at 20p and visually yet
another glass ceiling awaits any rising cycle. Only with closure beyond such a
level will we enthusiastically proclaim the potentials of 33p in the future.
At present, it’s worth remembering of the dangers below 7.65p and perhaps
simple remembering patience.
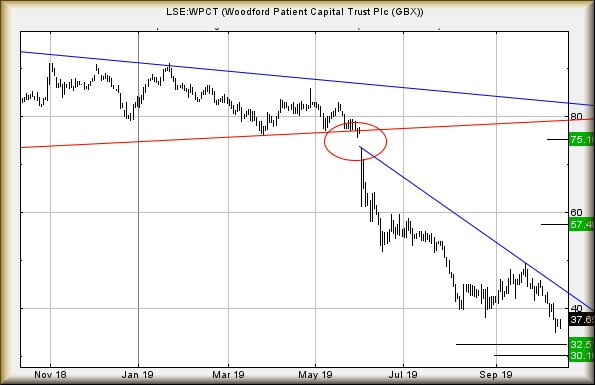
#Gold #SP500 Hell IS NOT Woodfords price movements, it’s two grand-daughters visiting for their school holidays. A normal morning has one of the dogs barking at a red squirrel outside. Monday morning at 7am instead had a child playing a 12 string guitar, accompanied by the other on a mandolin. Neither child can play an instrument; a stupid promise of being taught some basics this week ensured a really unpleasant wakeup. Thankfully chainsaw lessons had not been mentioned!
Last time we reviewed Woodford (link),
we’d given 52.60p as level, below which, opened the gates of hell. Once again,
we’ve had a few emails asking us to explore what may be coming next. There’s a
fairly major issue as last time, we were unable to calculate below 52.60p
without casually throwing minus signs into the conversation. This is still the
case but if we opt to work on the period from the point the share was forced
down (circled) from the 80p region, there’s something potentially interesting.
At time of writing, it’s trading at 37.6p, needing
below 35p to once again serve notice of trouble. This time, below 35 indicates
the potential of movement to 32.5p with secondary, if broken, down at 30p. Given
these are virtually the same number, the usual suggestion is of a share
approaching a real bottom, a level at which a rebound can be indicated.
All this Brexit nonsense was the subject of
conversation at the weekend. A chum was visiting, a bloke whose company
specialises in asbestos survey pre-renovation or demolition. Over the years,
we’ve learned to associate the volume of his work with how busy the economy is
going to be. The thinking is fairly simple, if corporate bodies are employing
him, there’s a fair bit of money about to be spent. Presently, he’s turning away
contracts, due to being deluged with public and private sector requests. Given
historical experience, thoughts of a slump post Brexit are liable to fade.
For the likes of Woodford, a trust fund suffering some
investment choices which, for now, appear dreadful, if there is a miracle surge
in share prices post-Brexit (if it ever happens) we’d suspect Woodfords share
price to echo the wider market. This is why we’re a little bit interested at the
“feel” of it approaching a bottom.
Sensible people, opting to play safe, will doubtless wait and see if the
share recovers above 50p. In such an event, we’re calculating an initial
ambition at 57.5p with secondary, if bettered, a longer term 75p. Beyond 75p and
we shall need shake the tea leaves again.
Otherwise, it is worth remembering the share, despite our slight enthusiasm,
is trading in a region where The Big Picture cannot calculate a bottom without
minus signs!
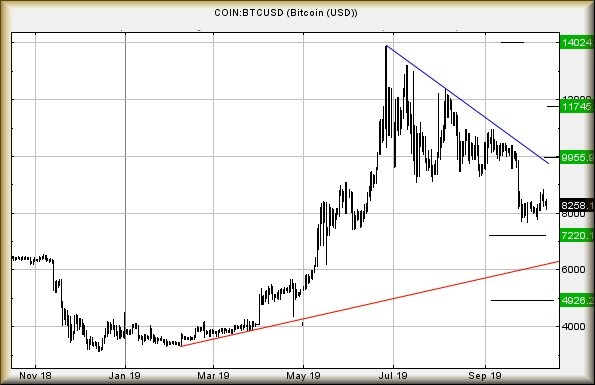
Bitcoin BTCUSD With Jeremy Clarkston making “Who Wants to Be A Millionaire” viewable, utter shock was experienced losing £32,000 hypothetical pounds when getting an answer wrong! The reason; being 100% certain Pioneer 1 visited Mars while the Viking space probe did Venus & Saturn, with the idiot on TV walking into the trap, saying “Viking”. Except, of course, for a tiny little problem ; my 100% certainty was utter tosh.
Thankfully, this sort of nonsense rarely translates to
our attitude against prices as we’re able to constantly weigh forces, usually
able to make a reasonable bigger picture decision with a fair chance of
accuracy. Further to our report in September, Bitcoin indeed tumbled to 9218 and
in the period since, has hovered above our secondary longer term target at 7220.
So far, the closest achieved has been 7665 dollars, visually giving an
impression it may be “close enough” to bottom, if any real strength is apparent.
We’re not entirely sold on the idea, thanks to the BLUE
downtrend. It suggests Bitcoin presently requires exceed 9900 before we dare
start to trust any rise. The reason is fairly painful as weakness now below 7665
indicates expected travel to an initial 7220 with secondary, if (when) broken,
now at a long term 4,900. Despite such a secondary sounding like a substantial
drop, it simply returns Bitcoin to the levels of April this year. In plain
English, the forces against Bitcoin, even though it has not achieved our 7220,
remain down at present.
To give an indication any rise my prove genuine, the price needs above 9534 as this apparently calculates with an initial ambition at 9955. If exceeded, secondary calculates at 11745, along with almost certain hesitation.
#SP500 #JAPAN As the clock ticks down (or not) to Brexit, we’ve been considering suggestions on how to trade! The reason is fairly basic, there’s a good chance of market volatility with a bunch of lazy writers quoting trite Warren Buffet sayings. It would be nice to say we already know what’s coming but it’d also be utter bulls**t. While many respected economists are queuing up to do their “talking heads” thing to predict calamity, famine, markets crashing, lack of toilet paper, etc, it’s worth remembering not a single one of them got it right with the crash which culminated in 2009, a crash we still feel the effects of.
It’s possible, if these clowns are predicting chaos, we
should actually anticipate the opposite, should Brexit actually happen.
One thing is certain. Even if there is no chaos, the
market will invent some on Brexit day as wild swings will be the immediate
fashion. Of course, the reason for wild swings is rather less glamorous than
folk like to admit. A game of “trap the stop loss” and “trigger the order” will
commence, effectively meaning STOPS and ORDERS risk proving a really bad idea.
Imagine, for instance, a trader with a cunning plan
which involves Lloyds shares. Visually, there’s a heck of an argument suggesting
this should go up in price, if it only betters 57p. Equally, if it drops below
48p, it’s probably going down. On Brexit day, it would be perfectly feasible for
the price to surge to 57p for a second, triggering the buy order. And at 2
seconds past 8am, it would probably fall below 48p, triggering the stop loss.
So, if the trader had allocated £10K to the Lloyds
trade, they’d lose nearly £1,600 within the opening seconds of the market day.
This is not a fairytale, it happens.
To trade safely at Brexit, if Brexit ever happens,
STOPS are liable to be the enemy and therefore, worth either expanding to absurd
levels or removing entirely. Equally, on the subject of ORDERS, they can prove
dangerous unless opting to chase the absurd. In the case of Lloyds, a buy order
around 30p would make sense. RBS on the other hand allows 142p, perhaps even
100p.
We’ll cover this in greater detail as the month
unravels.
As for Friday, the FTSE is making as much sense as a
Labour politician when asked their policy on Europe. While genuinely preferring
to avoid distain and distrust against any specific party (they all deserve it),
Labour justifying a position where they approve of Europe membership, while
being determined to leave is frankly beyond parody. Even up here in Scotland,
lunatics appear to be flourishing in politics.
At a time when almost 1/4 million Scots marched in
torrential rain, on Edinburgh last weekend for independence (somehow the media
didn’t notice nor did the SNP) and nearly 2/3 of the country voted Remain, it
would be logical to expect the SNP to be working hard to achieve their
independent aim? Nope, their focus appears to be on saving England from its
apparently mistaken belief that Leaving Europe is a good thing. Scottish
politicians seem to be competing with the national football team in achieving
absolutely nothing and being a joke in their own country.
The index closed Thursday at 7197 points and appears to
have set 7225 points as a valid trigger level for any real rise. Above 7225
expects a useless 7235 points initially with secondary, if bettered, at 7309
allegedly. Recent market behaviour has seen rises fail roughly half way to their
secondary and if this is the case again, the index will probably fizzle at 7270
points or so.
If triggered, the tightest stop looks like 7140 points.
The alternate position; what happens if 7140 breaks? We
calculate reversal to an initial 7122 with secondary, if broken, at 7091 points.
We’d add, if the index starts trading below RED, this years uptrend, Boris need
only announce something daft to provoke 7027 points very fast.