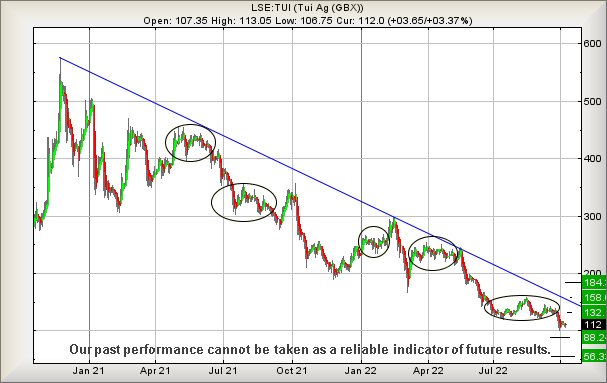
#FTSE #STOX Perhaps, with this little “lesson” on charts, we shall be preaching to the choir with TUI but there’s a signal which tends be invaluable. It’s when a price achieves a degree of stability, especially in a downward cycle, this stability often ending with a “Gotcha suckers” leap off a cliff. With TUI, the leaps are proving to be careful steps down, movement from the 400p lever leading down to 300p.
Then, after a reasonable period of mourning at discovering this low, probably convincing many investors 300p was “bottom”, it again stepped down to 250p. Once sufficient numbers convinced themselves this was obviously a solid bottom, the price remorselessly stepped down to 150p. And now, it almost feels like the current price level is being “sold” to the market as a probable bottom. Obviously, as utter cynics, we’re not entirely convinced, due to the presence of a Big Picture bottoming potential now calculating at an eventual 56p.This is a price level we cannot calculate below.
We’re a little surprised at the lack of vibrant atmosphere around TUI. Firstly, there’s the bloke next door! As our dogs are best friends, he habitually dumps his mutt with us when he flies abroad for a quick holiday. This year, he’s managed to vanish for 6 weeks (so far), describing visits to destinations as like stepping back 30 years, without the usual tourist mobs. However, returning today from the far east, he noticed (quite miserably) passenger numbers are increasing. We noticed, (hopefully) TUI recently reported their winter bookings at 78% of pre-Covid levels. Yet their share price languishes at 12% of pre-pandemic levels!
The current picture remains dubious, movement below 100p working out with the potential of reversal to 88p next. We would hope for a bounce at such a level, especially as it looks like the last port of call before our ultimate bottom of 56p. If there’s any residual strength, 88p should be “it”, in plain English, anytime now for a bounce.
Our inclination is to allocate 120p as a viable trigger level, due to movement above such a point calculating with the chances of a visit to 132p next. If bettered, our secondary comes along at a potentially game changing 158 – game changing because such a travel ambition takes the price above the ruling downtrend, into a region where a 3rd level target of 184 should be viable. However, our (usual) demand remains valid, we need see the share price actually close above the Blue downtrend.
In summary, we suspect TUI are close to bottoming, perhaps needing fingers crossed before daring to become involved.
FUTURES
| Time Issued | Market | Price At Issue | Short Entry | Fast Exit | Slow Exit | Stop | Long Entry | Fast Exit | Slow Exit | Stop | Prior |
| 9:54:01PM | BRENT | 92.91 | Success | ||||||||
| 9:55:51PM | GOLD | 1667 | |||||||||
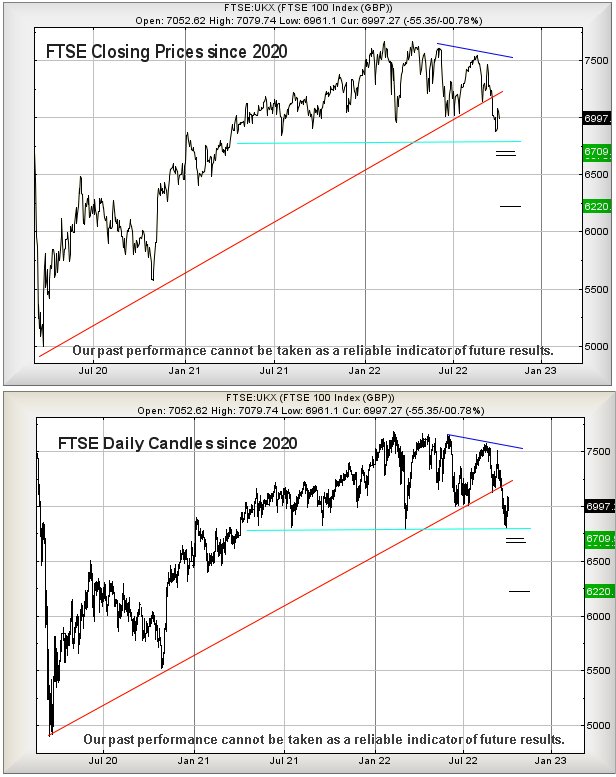
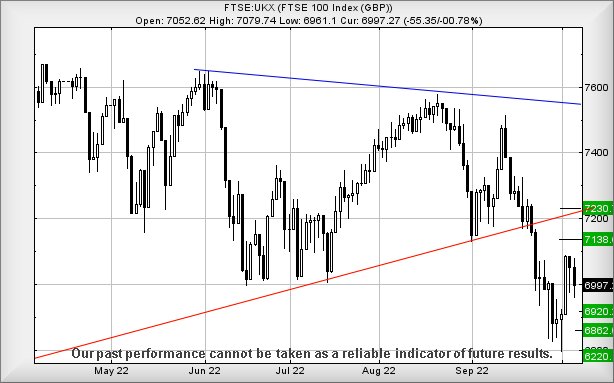
| 9:58:52PM | FTSE | 6878.98 | 6847 | 6808 | 6710 | 6912 | 6948 | 6985 | 7031 | 6888 | Success |
| 10:01:30PM | STOX50 | 3332.2 | 3307 | 3293 | 3272 | 3331 | 3356 | 3373 | 3395 | 3332 | ‘cess |
| 10:03:59PM | GERMANY | 12174 | ‘cess | ||||||||
| 10:06:25PM | US500 | 3597.37 | ‘cess | ||||||||
| 10:09:05PM | DOW | 29278.5 | ‘cess | ||||||||
| 10:11:26PM | NASDAQ | 10821.05 | ‘cess | ||||||||
| 10:13:33PM | JAPAN | 26369 | ‘cess |
11/10/2022 FTSE Closed at 6885 points. Change of -1.06%. Total value traded through LSE was: £ 5,136,859,995 a change of 18.36%
10/10/2022 FTSE Closed at 6959 points. Change of -0.46%. Total value traded through LSE was: £ 4,340,006,444 a change of -6.55%
7/10/2022 FTSE Closed at 6991 points. Change of -0.09%. Total value traded through LSE was: £ 4,644,361,624 a change of -27.89%
6/10/2022 FTSE Closed at 6997 points. Change of -0.78%. Total value traded through LSE was: £ 6,440,759,247 a change of 17.34%
5/10/2022 FTSE Closed at 7052 points. Change of -0.48%. Total value traded through LSE was: £ 5,488,765,319 a change of -9.96%
4/10/2022 FTSE Closed at 7086 points. Change of 2.58%. Total value traded through LSE was: £ 6,096,244,319 a change of 12.65%
3/10/2022 FTSE Closed at 6908 points. Change of 0.22%. Total value traded through LSE was: £ 5,411,543,289 a change of -20.03%
SUCCESS above means both FAST & SLOW targets were met. ‘CESS means just the FAST target met and probably the next time it is exceeded, movement to the SLOW target shall commence.
Our commentary is in two sections. Immediately below are today’s updated comments. If our commentary remains valid, the share can be found in the bottom section which has a RED heading. Hopefully, this will mean you no longer need to flip back through previous reports. HYPERLINKS DISABLED IN THIS VERSION
Please remember, all prices are mid-price (halfway between the Buy and Sell). When we refer to a price CLOSING above a specific level, we are viewing the point where we can regard a trend as changing. Otherwise, we are simply speculating on near term trading targets. Our website is www.trendsandtargets.com.
UPDATE. We often give an initial and a secondary price. If the initial is exceeded, we still expect it to fall back but the next time the initial is bettered, the price should continue to the secondary. The converse it true with price drops.
We can be contacted at info@trendsandtargets.com. Spam filters set to maximum so only legit emails get through…
Section One – Outlook Updated Today. Click here for Section Two – Outlook Remains Valid shares
Click Epic to jump to share: LSE:AVCT Avacta** **LSE:BARC Barclays** **LSE:BLOE Block Energy PLC** **LSE:CCL Carnival** **LSE:FRES Fresnillo** **LSE:HSBA HSBC** **LSE:ITM ITM Power** **LSE:JET Just Eat** **LSE:NG. National Glib** **LSE:OCDO Ocado Plc** **LSE:PHP Primary Health** **LSE:SMT Scottish Mortgage Investment Trust** **LSE:STAN Standard Chartered** **LSE:TERN Tern Plc** **
********
Updated charts published on : Avacta, Barclays, Block Energy PLC, Carnival, Fresnillo, HSBC, ITM Power, Just Eat, National Glib, Ocado Plc, Primary Health, Scottish Mortgage Investment Trust, Standard Chartered, Tern Plc,
LSE:AVCT Avacta. Close Mid-Price: 103 Percentage Change: + 5.10% Day High: 102 Day Low: 95.5
This is remains a nuisance as below 95 suggests coming weakness to an init ……..
</p
View Previous Avacta & Big Picture ***
LSE:BARC Barclays Close Mid-Price: 140.16 Percentage Change: -2.15% Day High: 142.22 Day Low: 139.56
If Barclays experiences continued weakness below 139, it will invariably l ……..
</p
View Previous Barclays & Big Picture ***
LSE:BLOE Block Energy PLC. Close Mid-Price: 2.3 Percentage Change: + 15.00% Day High: 2.3 Day Low: 2
All Block Energy PLC needs are mid-price trades ABOVE 2.3 to improve accel ……..
</p
View Previous Block Energy PLC & Big Picture ***
LSE:CCL Carnival. Close Mid-Price: 508.8 Percentage Change: + 1.48% Day High: 511.2 Day Low: 483.2
Continued weakness against CCL taking the price below 483 calculates as le ……..
</p
View Previous Carnival & Big Picture ***
LSE:FRES Fresnillo Close Mid-Price: 764 Percentage Change: -1.16% Day High: 776.2 Day Low: 756.4
If Fresnillo experiences continued weakness below 756, it will invariably ……..
</p
View Previous Fresnillo & Big Picture ***
LSE:HSBA HSBC Close Mid-Price: 454.5 Percentage Change: -1.78% Day High: 462.15 Day Low: 452.85
Continued weakness against HSBA taking the price below 452 calculates as l ……..
</p
View Previous HSBC & Big Picture ***
LSE:ITM ITM Power. Close Mid-Price: 97.62 Percentage Change: + 0.58% Day High: 99.88 Day Low: 95.12
Continued weakness against ITM taking the price below 95 calculates as lea ……..
</p
View Previous ITM Power & Big Picture ***
LSE:JET Just Eat Close Mid-Price: 1168 Percentage Change: -3.38% Day High: 1206.6 Day Low: 1136.8
Target Met. On deliveries below 1136 now point at 1053 next, hopefully wit ……..
</p
View Previous Just Eat & Big Picture ***
LSE:NG. National Glib Close Mid-Price: 883.8 Percentage Change: -1.89% Day High: 902.6 Day Low: 879.4
Target Met. Weakness now below 879 shows with quite a strong bounce potent ……..
</p
View Previous National Glib & Big Picture ***
LSE:OCDO Ocado Plc Close Mid-Price: 414.5 Percentage Change: -5.32% Day High: 442.9 Day Low: 415
Target Met. This is not having a fun time as weakness below 414 now calcul ……..
</p
View Previous Ocado Plc & Big Picture ***
LSE:PHP Primary Health Close Mid-Price: 101 Percentage Change: -2.32% Day High: 106 Day Low: 100.3
Target Met. Now looking grim, trouble below 100p risks a visit to 91 next ……..
</p
View Previous Primary Health & Big Picture ***
LSE:SMT Scottish Mortgage Investment Trust Close Mid-Price: 738 Percentage Change: -0.86% Day High: 747.2 Day Low: 721
In the event Scottish Mortgage Investment Trust experiences weakness below ……..
</p
View Previous Scottish Mortgage Investment Trust & Big Picture ***
LSE:STAN Standard Chartered Close Mid-Price: 547.6 Percentage Change: -3.90% Day High: 568.4 Day Low: 543.6
Weakness on Standard Chartered below 543 will invariably lead to 511 with ……..
</p
View Previous Standard Chartered & Big Picture ***
LSE:TERN Tern Plc Close Mid-Price: 7.1 Percentage Change: -2.07% Day High: 7.25 Day Low: 6.75
Continued weakness against TERN taking the price below 6.75 calculates as ……..
</p
View Previous Tern Plc & Big Picture ***