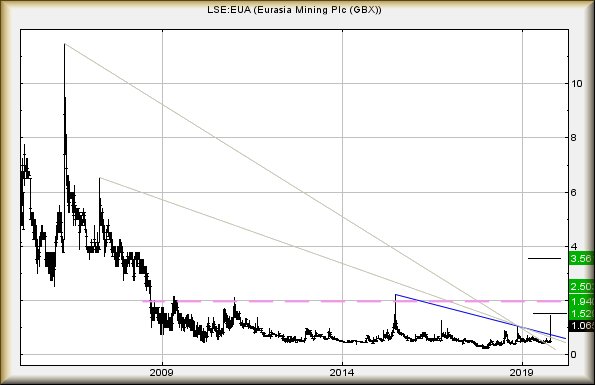
#Brent #DAX Eurasia, an open cast miner operating in the Urals, has been making some interesting share price movements recently. While there’s absolutely nothing indicating a return to the glory days, some fairly interesting potentials show for the near to mid term future. Visually, it appears the 2p level shall prove fairly key to indicate any level of realistic recovery.
At present, the share price is regarded as heading to
1.52p. In the event of it trading above such a level, continued growth to 1.94
calculates as very possible. On the chart, we’ve painted a purple line which
dates back to 2008. The share price has made repeated attempts at the 2p level
and now, only with closure at (or above) 1.94p shall we dare express confidence
in the direction of 2.5p.
There’s something quite off about the 2.5p mark.
Unusually, we can calculate the potential of a 3rd level target up at 3.5p. Just
a glance at historical movements highlights a further glass ceiling awaits at
the 3.5p mark. We sometimes speculate these points of hesitation are caused,
simply due to a share price meeting a level it used to trade at and a bunch of
folk dumping their holding, just to get some money back, the dreaded “Bail At
Break Even” crowd.
If it’s all going to go wrong, the price requires to
weaken below 0.8p to justify a panic. Such a trigger could easily witness a
return down to 0.3p.
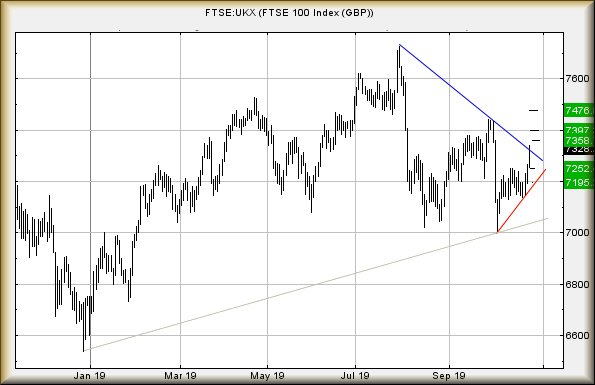
Free 1st Move Friday! Thursday appears to have produced a fairly important milestone in the Brexit saga, an episode of UK history which deserves its own theme tune. Perhaps a smart producer will hijack the “Jaws” tune and introduce real drama. The milestone? For me, it was the day I completely lost any understanding of what’s going on politically. In doing so, it’s possible I joined an entire parliament full of politicians in the land of clueless!
On Thursday, the FTSE should have reached 7333 and no
higher. We’d a fairly big rule demanding some hesitation at the 7333 level but
the market decided it had better ideas. It peaked at 7338 before a very slight
fallback. In doing so, it introduced an argument which favours movement now
above 7339 as being capable of 7358 next. If exceeded, our secondary calculation
comes in at a less likely 7394 points.
To be honest, if anyone figures out what the
politicians are up to and decides it’s good news, the index could easily
accelerate to 7474 points, a point where once again we’d expect some serious
hesitation.
Assuming the market nudges beyond 7339 points, the
index would need slip below 7292 points to give the first indication it’s all
going wrong. This makes for a reasonable stop loss level, given the potential
collection of points.
If the index does slip below 7292, this risks
triggering weakness down to an initial 7252 points. If broken, secondary
calculates at a trend testing 7195 points.
This week, every single session has been prefixed with
market movements suggesting the next day “almost must” move in a specific
direction. As a result, the following day generally enacts the precise opposite
of anything demanded by logic. It all leads to Friday, a day which clearly
suggests another UP day is in store for the FTSE. Therefore, we shall not be
surprised to witness relaxation to 7195 commence. Idiots appear to have taken
over the asylum – or Westminster.
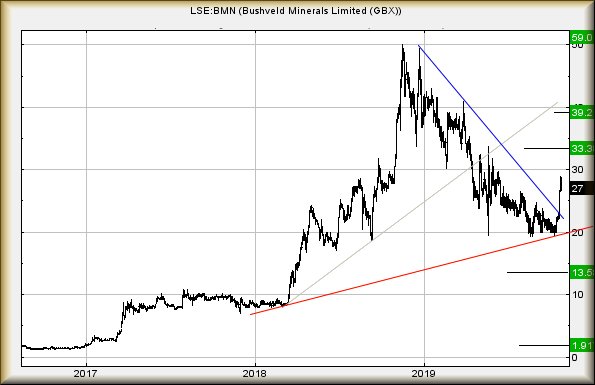
#France #Nasdaq Our review against this mob (link) a year ago proved pretty accurate, if somewhat painful for shareholders. Thankfully, the current situation is giving slight hope for the future. For visual reasons, the market has poured a glass floor against the price at the 19p level and the current bounce appears interesting.
Continued recovery above 29p calculates with an initial
ambition of 33p. If exceeded, ideally with the share closing above 33p, our
secondary comes along at a longer term 39p. Achieving 39p will be interesting as
visually, yet another glass ceiling awaits, one almost certain able to slow down
any rise. Despite being able to calculate beyond the 39p level, we have
considerable doubts due to a new all time high appearing possible. Perhaps the
company shall discover a goose involved in the production of golden eggs?
If there’s going to be trouble, the price would need
dig below 19p as travel down to an initial 13.5p looks painfully possible. If
broken, our secondary calculates at a “bottom” of 1.9p. This “bottom” is simply
the level below which we cannot calculate.
For now, we’re fairly optimistic for this mobs future
as it’s looking like an attempt at 33p is on the cards. In technical terms, it’s
“fingers crossed” time.
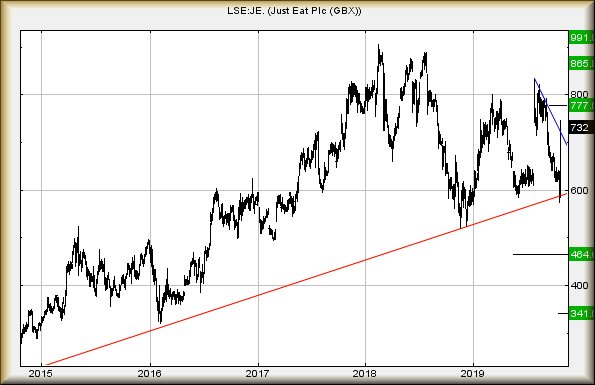
#FTSE #DOW One of the advantages of living in the sticks is a complete lack of exposure to this sort of company. Here in Argyll, fast food involves a phone call, a trip & stop at a cash machine, a natter with customers & staff at the takeaway. And of course, stopping for chocolate on the way home as a 1 hour journey completes. It’s what we call a social life, resulting in a situation with no clear understanding of the raison d’être for such a company.
Aside, of course, their habit of sponsoring TV shows, thankfully giving
families throughout the UK the point at which to fast forward through adverts
then press play to return to the show. While perhaps not the desired outcome of
such exposure, Just Eat now can make suffering an hour of the X Factor slim down
to a less strenuous 35 minutes.
Their share price has surged fairly impressively and now resides in a
situation where movement continuing above 747 should prove capable of a lift to
777p next. Visually, there appears ample reason for some hesitation at such a
level. In the event the share finds an excuse to close above 777, we’re able to
calculate secondary at 865p. Importantly, if positive news is involved, it could
easily fast forward up to 991p very quickly.
To convince us it’s all going wrong, the price would require break below RED,
presently at 570p, to enter a rewind back to 464p initially. If broken,
secondary is at 341p and hopefully a bottom.
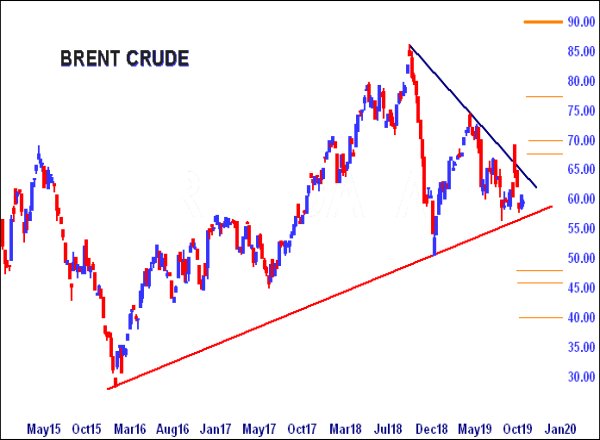
#GOLD #SP500 When we reviewed Brent last month in an utter panic, due to “the Saudi thing”, we’d glued on our usual caveat, saying ‘to justify concern in another direction, the price of Brent requires drip below 56.50 dollars’. Guess what? In the period since, Brent managed to hit 56.1 dollars, filling the first requirement to open the taps of doom.
Increasingly with the markets we’re opting to play
things a little safer, introducing something we call movement weights. This
nonsense, long used in-house, essentially provides the first calculation which
will signal whether a drop (or gain) is real. In the case of Brent, the
situation now is of weakness below 56.1 being capable of provoking reversal down
to an initial 53.78 dollars. In itself, a fairly insignificant movement but,
should 53.78 dollars break, we’d take this as a triggering motion which should
provide real reversal.
Thus, now below 53.78 looks capable of entering a cycle
down to an initial 48 dollars. Secondary, if broken, calculates at 46 and firmly
takes the black stuff into a region where it’s entirely possible 40 dollars
should provide an eventual bounce level.
When we apply similar logic to demand confirmation
movement in the other direction is viable, the stuff now needs exceed 63.8 to
confirm any trend break is genuine. Recovery such as this should trigger moves
to an initial 67.5 with secondary, if bettered, at 70.5 dollars. This sort of
thing takes the price into a region where a longer term 77 looks possible –
something very liable to be game changing from a big picture perspective. We’ve
pencilled 90 dollars as an eventual target!
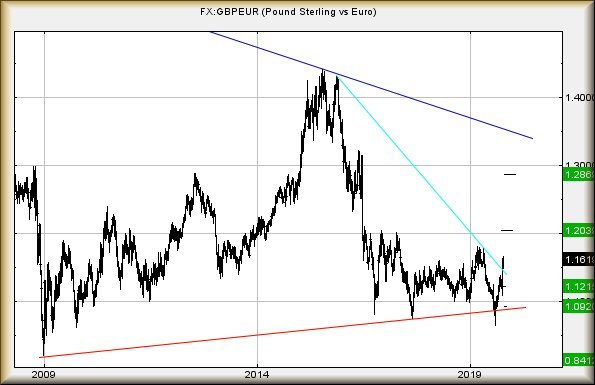
Brent DAX #GBPEUR feels like it should be a report at Easter! This currency pairing, for so long looking trapped in a dark cave, is actually starting to develop some recovery potentials. Perhaps Boris is doing a Mr Trump, ridiculed by media but regardless, appearing to do something right!
A key level has developed at 1.1688. This isn’t one of
our usual “higher high” things but instead, a calculated level above which it
‘should’ make travel toward 1.2039 difficult to avoid. In the event of the
market actually closing above this target level, a longer term 1.2869 computes
as possible.
It’s worth taking a step back and viewing the chart.
Historically, since 2016 this pairing has experienced issues at the 1.20 level.
For this reason, we’re suggesting only closure above 1.2039 is liable to
introduce the next big step in the pairings future. But it’s also worth
considering if the present Brexit hiatus continues, it’s very probable the
relationship will continue in a trading range between roughly 1.10 and 1.20.
For things to start going wrong, we would raise an
eyebrow if the pairing now weakens below 1.140 as this threatens reversal down
to an initial 1.1215. If broken, our secondary calculates at 1.0920. Visually,
this shall indicate a very firm return to being trapped in its “same old, same
old” trading range.
#FreeFutures Despite the FTSE index only being up 0.2%, it has been an extraordinary week for the market with surprising numbers of shares nudging above their growth triggers. Very few have reached their initial targets. Perhaps suggesting caution until news of a Brexit deal actually turns out to be real! Until then, just watch “The Good Place” on telly…
Even then, there risks being trouble on the horizon.
In a world already aflame with protest against
cack-handed government, Hong Kong protests invade our nightly news, protests on
Spain continued unabashed (unless including the bashing from the police), and of
course, French protests have become so commonplace, the media ignores them. In
the wings, the UK faces a problem with Scotland if the current agreement goes
ahead. Apparently it disadvantages the entire country, already agitating for
independence and voted nearly 2/3 against leaving the EU. While unrest from
Scotland feels unthinkable, nearly 4% of the population marched on Edinburgh in
foul conditions a few days ago in favour of independence. This massive turnout
was not widely covered by UK media, aside from an interesting analysis on the
BBC suggesting if more than 3.5% of a counties populace take to the streets,
their revolution will succeed.
Long story short, even if Westminster successfully
achieves some sort of Brexit agreement, it becomes highly unlikely we’ve seen
the end of this messy story as far as the UK is concerned.
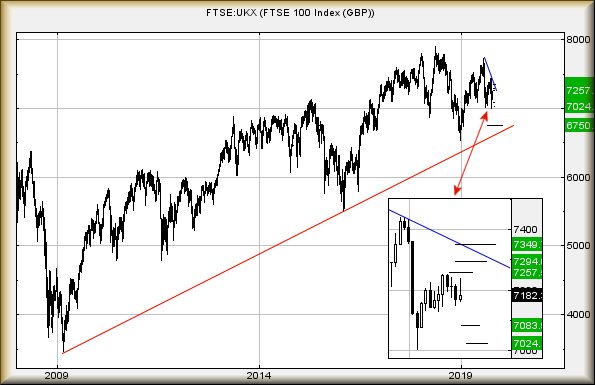
For Friday, the FTSE is in a fairly interesting
position. It closed Thursday at 7182 and needs exceed Thursday high of 7238
before we dare believe the FTSE is celebrating in earnest, showing the potential
of some real recovery. Near term, above 7242 indicates coming growth to an
initial 7257 points. If exceeded, secondary is a more useful 7294 points and a
level where some hesitation is expected. However, if the market opts to “go for
it”, we can mention a third level target at 7349 and this calculates as a
point where some volatility is expected. Interesting to note, it also intersects
with the downtrend since July.
As always, we’ve an “however” and alternate scenario.
The lowest the market has achieved in October has been 7004 points, this being a
concern. We had calculated a “bottom and bounce level” at 7034 points and the
index squirmed below. Thankfully, for those chasing a bounce, we’d also proposed
a stop loss around 6,990 points and the index has certainly provided payback.
But our 7034 did break, hinting at a risk of real
weakness if sufficient excuse discovered.
Now, below 7141 calculates as entering a cycle down to
an initial 7083 points. If broken, secondary calculates at 7024. This again
shall take the FTSE into the land of lower lows where an ill timed Tweet or
political quote could rapidly provoke reversal to 6750 points.
For now, we shall not be surprised to witness 7349
before everything unravels again.