#GOLD #SP500 When asked to review #Sylvania, it occurred we very rarely pay attention to this, one of the Earths rarest metals. Spanish miners once regarded it as an unwanted impurity in the silver they were mining, a mistake unlikely to be made today. There’s something happening with the price of platinum and we’ll deal with that first.
Presently trading around the 950 dollar mark, Platinum
looks very capable of heading to 1,030 next. If exceeded, we expect some
stutters around our secondary calculation of 1,060 dollars. The price needs
reverse below 930 dollars to provoke hysterics against these calculations.
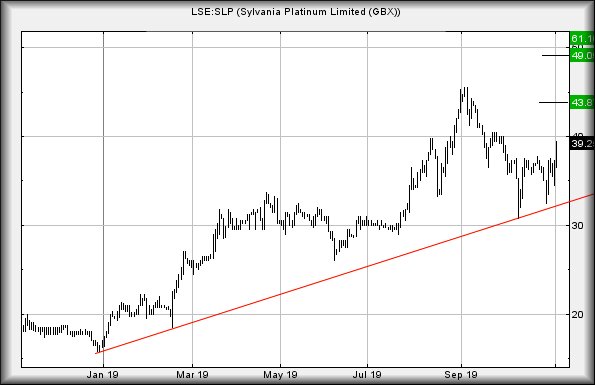
If Sylvania Platinum share price intends reflect the
change in fortunes for the metal itself, price growth now above 39.5p suggests
coming recovery to an initial 43.8p. If exceeded, our secondary calculates at a
longer term (or later that day!) 49p.
Achieving 49p is liable to be almost game changing for
the longer term. If the share price manages to close a session above 45.5p, it
enters the hallowed lands of “the higher high”. To us, this means we require
extrapolate price movement from 2013 to calculate the force driving it for the
future. While this sounds like complex mumbo jumbo, it’s fairly simple logic
which implies, essentially, positive market conditions allow a long term attempt
at 61p before we run out of numbers.
At present, the share needs below 32p before we’d feel
our optimism is about to be trashed.
#BRENT #DAX Similar to UK politics, this is on the edge of becoming interesting. We last reviewed Metro in September (link) and we’d some pretty foul expectations for its future. Something seems to have changed and now, we’ve calculated a trigger level which appears capable of provoking a “sure thing” trade!
There’s no such thing as a “sure thing” and to be
blunt, the best we’d describe the potential is one of movement with an enhanced
expectations. Perhaps, a bit like saying some MP’s will be elected on December
12th, just we’re not sure whom nor where…
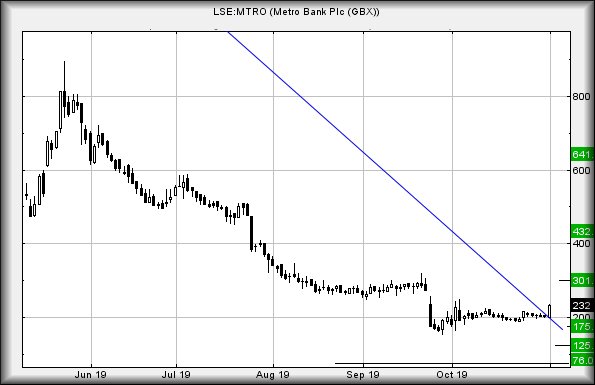
To cut to the chase, the situation appears to be fairly
straightforward. If this lot now manage trades above 248p, we’re calculating an
initial 301p as an initial target ambition. Visually, this makes a lot of sense,
matching the plateau of prices until September 23rd. In fact, if 301p makes an
appearance, the share can be expected to experience some hesitation thanks to
folk trapped at the 3 quid level dumping their shares in exchange for cash,
doubtless to be wasted on Xmas presents, frivolity, or any number of undeserving
causes which appear at this time of year. (Guess who made the mistake of going
Xmas shopping at the weekend!)
Longer term, closure above 301p is liable to prove
interesting, calculating with a surge to a vague looking 432p. In fact, we’re
supposed to believe 641p is exerting an influence, a price level we’re less than
confident about. In this instance, the only movement which appears to have some
confidence is from 248 up to 301p.
If it’s all going to go wrong, the price needs fail
below 198p at present to give serious alarm as this appears capable of bringing
175p initially. If broken, secondary computes at 125p and hopefully a bottom
capable of providing a rebound.
For now, it appears worth keeping an eye on for our
trigger level making an appearance.
#FreeFirstFuturesA week with a FTSE being underwhelmed by UK political decline appears to be finally responding in true Halloween fashion – scary but not really! It doesn’t even look like we shall find our hallowed leaders body in a ditch, despite his preferred method of exit in the absence of Brexit. Trump & Clinton once did a televised debate, managing avoid noticing viewers found both of them abhorrent. It looks like the UK’s political leaders are intending embrace similar levels of self delusion but it’s not supposed to be this way, is it? Voting papers should have a “None Of The Above” option to ensure career politicians do not win by default.
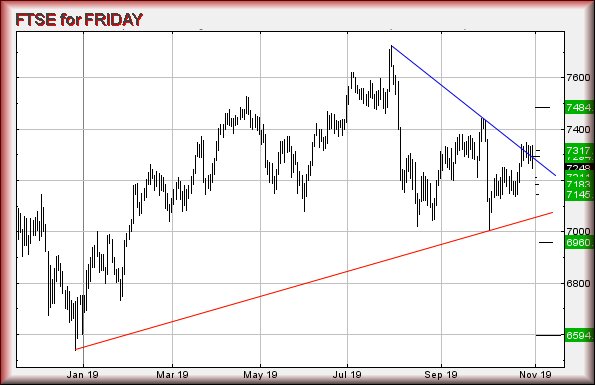
The market has spent the last 5 sessions flirting with
the 7330 level for some reason. Now, it feels like some reversal is almost upon
us and oddly, the key trigger level looks like 7,234 points. We cannot
understand why this has happened but the situation presently appears to suggest
only if the index moves more than 100 points from its previous parking level
should we believe more reversal is upon us.
The market closed Thursday at 7,248 points. Now below
7,230 and we expect reversal to an initial 7,211 points. If broken, secondary
calculates at 7,183 points. And if triggered, the tightest stop appears to be
quite reasonable at 7,272 points.
The alternate scenario appears to be at 7,281 as
movement above this trigger is supposed to be capable of a truly unimpressive
7,294 points. If bettered, our secondary calculation comes in at 7,317 points.
If triggered, the tightest stop looks like 7,245 points.
For light relief, we’ve shown some bigger picture
targets, suggesting target levels if “it all goes wrong – or right”. To be
blunt, unless the FTSE experiences a miracle and starts trading above the
aforementioned 7,330’s again, it’s now trading in a region with a bottom at
6,594 points eventually. If it were a share, we’d already assume that’s where
the price intends head. Amazingly, it would suggest a return to the FTSE level
the year started with, along with a strong hint we forget 2019 even happened.
Have a good weekend, it’s time for Austin, Texas &
Formula 1, hopefully the UK driver Hamilton winning his 6th world title. (Though
everyone knows it’s really his 7th)
#SP500 #Japan Eurasia rather neatly illustrated why timeframes are difficult. No-one realistically expected a 223% rise through ALL our targets (link) in just 3 days but #Eurasia managed. Today, assisting a chum with a pre-demolition survey gave a sharp reminder why care is needed, when things go volatile.
We were at a mid 1800’s villa, a completely overgrown
structure destined for landfill. My “job”, ensuring my chum didn’t find himself
trapped in a remote location in Argyll, such was the dodgy nature of the
building. More importantly, it was an excuse to bring a big chainsaw to create
access to the property. Ivy had grown quite energetically with the result we
simply could not see the roofline of the derelict house. Worse, Larch and
Hawthorne trees had claimed ownership of the gardens, some of the hawthorns
growing against the outer walls of the building. A particular tree gave concern,
vanishing into the mass of Ivy with the result an initial chainsaw cut ended in
blissful silence, using a handsaw. If things are going to go wrong, generally
alarming sounds will come from a tree. If using a chainsaw, the noise of the
machine plus ear protection can catch the unwary.
In this instance, the tree trunk suddenly shattered,
along with interesting groans from overhead. We’d already planned escape routes
and fled. The tree had been holding an immense mass of ivy, all of which
discovered gravity. This was the start of a lively process, the roof collapsing
inward and the exterior wall following. Essentially, the building was held up by
vegetation alone and our pre-demo survey turned into an accidental demolition,
one we’d thankfully prepped for.
To be honest, it was all great fun and a sharp reminder
things which go up can also come down, fast! Which finally brings us to Eurasia
for the 2nd time this week.
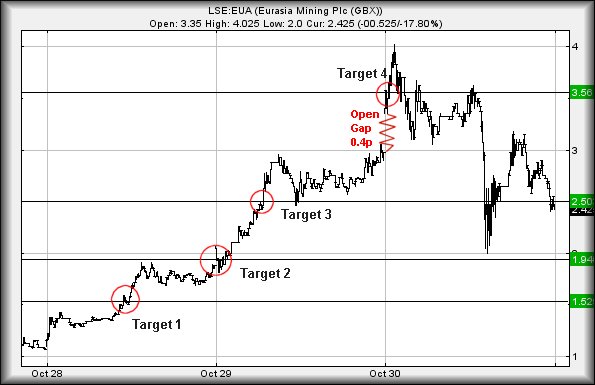
To give a perspective against this, we’re showing two
charts. The upper chart shows minute by minute movements since the market opened
on Monday morning, following our report on Sunday evening. It’s always
interesting and useful to see how a price reacts when a target level is
achieved.
Often, we will say something like, “if exceeded, our
secondary calculates at …” but sometimes we remember to write; “if exceeded on
the initial surge, secondary calculates at…”. Showing Eurasia in detail mode
tends highlight the logic behind this. When the price hit Target 1, it exceeded
it. When the price hit Target 2, it exceeded it. When the price hit Target 3, it
exceeded it.
And when the price hit Target 4, yes, it did exceed
target but as the ZigZag shows, the share was manipulated upward at the open.
So, even though the target level we’d mooted on Sunday evening was actually
dramatically exceeded by 0.5p, the price had been gapped up by 0.4p to ensure
this happened. The ensuing reversal thereafter to 2p wasn’t exactly a surprise.
As the chart shows, the price attempted further breaks above 3.5 but eventually
it failed and the inevitable occurred.
So what now. Is the price about to disappear into a
hole in the Ural Mountains, faster than Spanish riot policemen chasing tourists
in Barcelona?
Certainly, we’ll be quite concerned if it trades (as
opposed to forced down in the opening second) below 2p. Such a movement risks
quite nasty reversal with 1.7 calculating as possible and secondary, if broken,
comes along at 1.10p. We’d certainly hope for a bounce around the 1.10p mark but
thanks to that gap, the price risks 0.9 before a rebound.
However, we’ve a sneaking suspicion the share will
probably mess around a while, ideally with 2p as the bottom of a trading range.
We’re not ignoring the salient detail of our 3.56p ambition being exceeded, even
when we factor in the 0.4p gap. As a result, anything now above 4.03p should
prove capable of a lift to 5.25 with secondary, if exceeded on the initial
surge, calculating at 7.25p.
Visually, it appears the 10p level is the longer term
thing to watch. Only if this lot find an excuse to trade above such a level
shall we anticipate further fireworks, rather than a horror story.
#FTSE #Nasdaq Once again, it’s that time of the year when we must remember neither Santa nor Politicians oaths are real. After all, a new wrinkle to the old joke; “How can you tell if a politician is lying? – ‘Cos you’ve not read their obituary yet!” has been provided by Doris as it appears unlikely he shall be found in a ditch on November 1st.
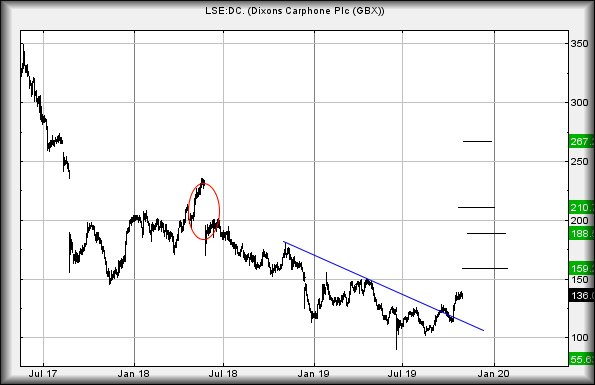
We last covered Dixons a year ago and their price movements now appear to
suggest a surprising change in mood. The share price need only trade above 140p
to enter a cycle which suggests some coming recovery toward an initial 159p. If
exceeded, secondary calculates at a rather impressive, if visually questionable,
210p. Our excuse for questioning such a target level is fairly simple. For some
reason, targets which sit 1/2 way in the middle of a gapped down (manipulated)
region rarely turn out to be correct. We’re no idea why this is the case but
over the years, we’ve learned to take such ambitions with a pinch of salt. In
the case of Dixons, we suspect any rise which does exceed 159p is liable to
fizzle out around the 188p level as the force of the gap down in May of last
year looks capable of throttling a rise.
Our previous review of Dixons had given a drop target at 110p, something obviously achieved. Our secondary had a question mark over it as the calculation gave 55p as “bottom”. As this was precisely 1/2 our initial target, if didn’t ring true. Instead, despite a break of 110p, the lowest achieved since was 89p and the market appears to be making an effort to recover the price. At present, anything which gave Dixons share price an excuse to fall again below 110p will now be perfectly capable of 55p as “bottom” eventually. The visuals do not suggest this is likely.
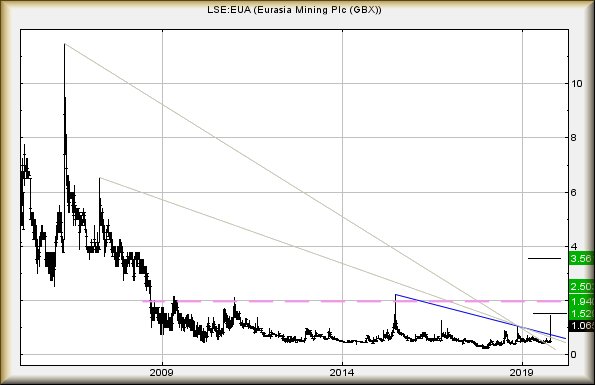
#GOLD #SP500 Our report yesterday against #EurasiaMining provoked a
"bloody ‘ell" moment in the office. We didn’t expect an 67+% rise the next day.
Importantly, the price has NOT yet reached our 1.94, the best achieved being
1.92 and thus, the initial target has not been exceeded (yet). If it goes nuts
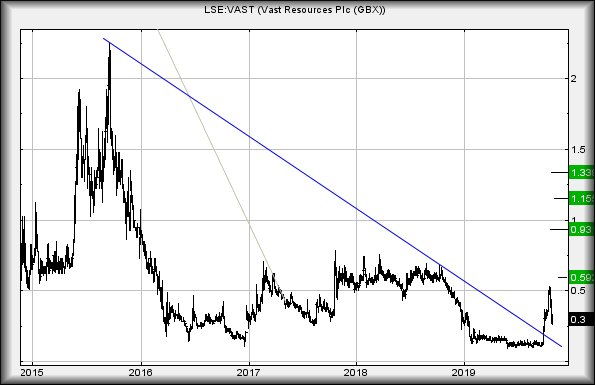
again, we shall revisit the share. As for VAST, are we expecting similar
behaviour?
Presently at 0.3p, the share needs trade above 0.39 to give sufficient
ammunition to a calculation which projects a useless movement to 0.46p. All
kidding aside, the really important stuff starts to happen if 0.46 bettered as
our secondary computes at 0.59p. Visually, this projects the share into "game
changing" territory as realistically 0.93p looks capable of presenting a longer
term (or the next day!) attraction.
It’s certainly a complicated share but worth remembering you are playing with
fire. The chart suggests since September, something has been happening to
shatter the calm of 2019’s lack of price movement, so perhaps it’s worth keeping
an eye open in the week ahead.
The price would require slippage below 0.2p to justify hysterics as we cannot
calculate any sort of bottom number. Will it ever recover to its historical
highs of 30p? We suspect only, if it lives up to its name and discovers some
Vast Resources… Maybe worth seeing what the chatrooms are saying on the
internet.
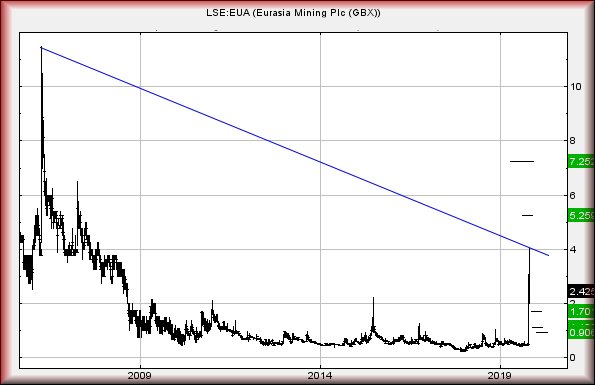
#Brent #DAX Eurasia, an open cast miner operating in the Urals, has been making some interesting share price movements recently. While there’s absolutely nothing indicating a return to the glory days, some fairly interesting potentials show for the near to mid term future. Visually, it appears the 2p level shall prove fairly key to indicate any level of realistic recovery.
At present, the share price is regarded as heading to
1.52p. In the event of it trading above such a level, continued growth to 1.94
calculates as very possible. On the chart, we’ve painted a purple line which
dates back to 2008. The share price has made repeated attempts at the 2p level
and now, only with closure at (or above) 1.94p shall we dare express confidence
in the direction of 2.5p.
There’s something quite off about the 2.5p mark.
Unusually, we can calculate the potential of a 3rd level target up at 3.5p. Just
a glance at historical movements highlights a further glass ceiling awaits at
the 3.5p mark. We sometimes speculate these points of hesitation are caused,
simply due to a share price meeting a level it used to trade at and a bunch of
folk dumping their holding, just to get some money back, the dreaded “Bail At
Break Even” crowd.
If it’s all going to go wrong, the price requires to
weaken below 0.8p to justify a panic. Such a trigger could easily witness a
return down to 0.3p.