#Gold #S&P500There’s a chart signal which is generally more reliable than a Weather Forecast or a BBC News report and currently, M&S are displaying it quite explicitly. In fact, we could even say; “This isn’t just a Chart Signal, it’s a Marks & Spencer Chart Signal” with a reasonable hope our projected outcome shall prove to be correct. Of course, there’s always a fly and always some ointment but visually, this one looks pretty amazing.
A few pundits have been advocating M&S as a Strong Buy, thus provoking a few emails in our direction for an opinion. Surprisingly, we ALMOST agree with them but the set of squiggles which comprise the chart confirm something we often bang on about. The level of a Trend Break is almost always really important.
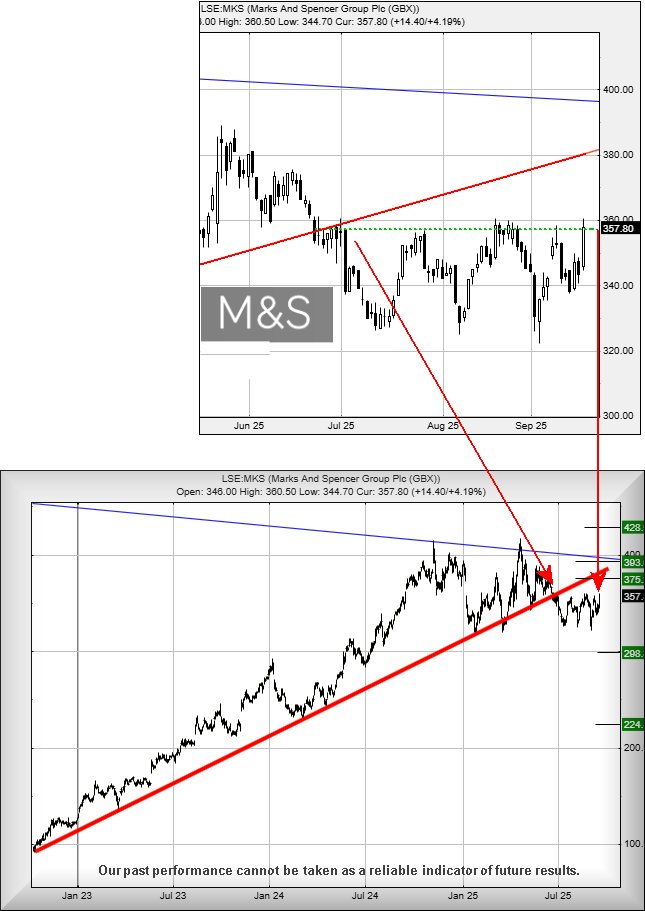
In the case of M&S, the chart extract below shows a nice little Green line, representing the price level above which we require the share to close, potentially presenting a scenario where some real price growth can be anticipated.
Essentially, in a textbook example of our thoughts, share price closure above 360p should make movement to an initial 375p almost certain. Our secondary, if exceeded, calculates at a future 393p. This sort of near 10% price recovery would emplace the share price on a path to a long term 428p.
But of course, there’s an issue. This is the Stock Market and it’s rare for something as “drop dead obvious” as this to appear. Thus, we should suspect a trap for traders is looming, aside from the absurd (but real) detail of “that’s what they’d want us to think!”
To be blunt, we do anticipate M&S enjoying an upward surge and given share price movements since July, it looks pretty confident. Their share price needs close below 330p before the need to buy; “these are not just any running shoes, these are Marks & Spencer running shoes…”
FUTURES
FUTURES
| Time Issued | Market | Price At Issue | Short Entry | Fast Exit | Slow Exit | Stop | Long Entry | Fast Exit | Slow Exit | Stop | Prior |
| 10:27:36PM | BRENT | 6766 | |||||||||
| 10:31:37PM | GOLD | 3959.29 | 3645 | 3639 | 3616 | 3672 | 3708 | 3718 | 3742 | 3780 | ‘cess |
| 10:37:44PM | FTSE | 9203.5 | |||||||||
| 11:12:59PM | STOX50 | 5376.1 | ‘cess | ||||||||
| 11:15:58PM | GERMANY | 23401 | ‘cess | ||||||||
| 11:19:58PM | US500 | 6609.3 | 6550 | 6539 | 6507 | 6595 | 6625 | 6631 | 6656 | 6600 | Success |
| 11:23:44PM | DOW | 46058.5 | Success | ||||||||
| 11:27:22PM | NASDAQ | 24273.7 | Success | ||||||||
| 11:29:51PM | JAPAN | 44903 |
17/09/2025 FTSE Closed at 9208 points. Change of 0.14%. Total value traded through LSE was: £ 5,188,517,809 a change of -11.11%
16/09/2025 FTSE Closed at 9195 points. Change of -0.88%. Total value traded through LSE was: £ 5,836,701,503 a change of 13.9%
15/09/2025 FTSE Closed at 9277 points. Change of -0.06%. Total value traded through LSE was: £ 5,124,504,308 a change of 3.82%
12/09/2025 FTSE Closed at 9283 points. Change of -0.15%. Total value traded through LSE was: £ 4,936,038,879 a change of -3.79%
11/09/2025 FTSE Closed at 9297 points. Change of 0.78%. Total value traded through LSE was: £ 5,130,576,096 a change of -11.59%
10/09/2025 FTSE Closed at 9225 points. Change of -0.18%. Total value traded through LSE was: £ 5,802,988,432 a change of 11.05%
9/09/2025 FTSE Closed at 9242 points. Change of 0.23%. Total value traded through LSE was: £ 5,225,634,176 a change of 25.23% 
SUCCESS above means both FAST & SLOW targets were met. ‘CESS means just the FAST target met and probably the next time it is exceeded, movement to the SLOW target shall commence.
Our commentary is in two sections. Immediately below are today’s updated comments. If our commentary remains valid, the share can be found in the bottom section which has a RED heading. Hopefully, this will mean you no longer need to flip back through previous reports. HYPERLINKS DISABLED IN THIS VERSION
Please remember, all prices are mid-price (halfway between the Buy and Sell). When we refer to a price CLOSING above a specific level, we are viewing the point where we can regard a trend as changing. Otherwise, we are simply speculating on near term trading targets. Our website is www.trendsandtargets.com.
UPDATE. We often give an initial and a secondary price. If the initial is exceeded, we still expect it to fall back but the next time the initial is bettered, the price should continue to the secondary. The converse it true with price drops.
We can be contacted at info@trendsandtargets.com. Spam filters set to maximum so only legit emails get through…
Section One – Outlook Updated Today. Click here for Section Two – Outlook Remains Valid shares
Click Epic to jump to share: LSE:BBY BALFOUR BEATTY** **LSE:CNA Centrica** **LSE:HSBA HSBC** **LSE:SBRY Sainsbury** **
********
Updated charts published on : BALFOUR BEATTY, Centrica, HSBC, Sainsbury,
LSE:BBY BALFOUR BEATTY. Close Mid-Price: 628.5 Percentage Change: + 1.05% Day High: 637 Day Low: 622
Further movement against BALFOUR BEATTY ABOVE 637 should improve accelera ……..
</p
View Previous BALFOUR BEATTY & Big Picture ***
LSE:CNA Centrica. Close Mid-Price: 169.2 Percentage Change: + 3.58% Day High: 170.2 Day Low: 166.25
Further movement against Centrica ABOVE 170.2 should improve acceleration ……..
</p
View Previous Centrica & Big Picture ***
LSE:HSBA HSBC. Close Mid-Price: 1014.8 Percentage Change: + 1.32% Day High: 1018 Day Low: 1003.8
All HSBC needs are mid-price trades ABOVE 1018 to improve acceleration to ……..
</p
View Previous HSBC & Big Picture ***
LSE:SBRY Sainsbury. Close Mid-Price: 323.8 Percentage Change: + 0.31% Day High: 333.6 Day Low: 323.4
Target met. Further movement against Sainsbury ABOVE 333.6 should improve ……..
</p
View Previous Sainsbury & Big Picture ***