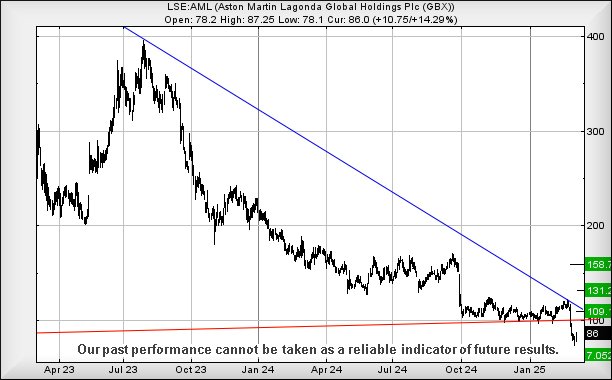
#Gold #SP500 With arguably the best car design wizard Adrian Newey joining their team, on paper, it’s certain the team should face an interesting 2025 season. There is an obvious wrinkle with their two drivers, one of whom has questionable driving ability and the other boasting a dodgy past. Unfortunately, the stock market appears to be venting its opinion before a wheel has even turned, Aston Martin share price now resting in a place which threatens a visit to the scrap yard rather than any winners podium.
From our perspective, Aston Martin share price is in a dire position, its recent drop below Red on the chart exposing the share price to an extremely painful Big Picture potential. It’s now trading in a zone where it’s apparently being attracted by an ultimate bottom of just 7p. Now matter which calculation we throw at Astons price movements, this is the only consequence showing if the price wanders below 72p anytime soon. We’re far from hopeful their Formula 1 team shall provide any reason for positive emotion in the marketplace.
Of course, perhaps Aston Martin have a trick up their sleeves, giving the stock market an excuse to push the share price up above the Red uptrend since 2022. Such a movement would certainly prove significant, potentially provoking recovery to an initial 109 with our secondary, if bettered, at 131. This would effectively dump the share price in a zone where a longer term 158p becomes possible.
We’re not hopeful, anticipating yet another race season where Aston Martin become another “also ran” racing team, making up numbers to give the impression of fair racing.
.
FUTURES
FUTURES
| Time Issued | Market | Price At Issue | Short Entry | Fast Exit | Slow Exit | Stop | Long Entry | Fast Exit | Slow Exit | Stop | Prior |
| 10:56:35PM | BRENT | 6928 | ‘cess | ||||||||
| 11:15:08PM | GOLD | 2918.56 | 2895 | 2885 | 2870 | 2920 | 2931 | 2962 | 3005 | 2902 | |
| 11:34:57PM | FTSE | 8785.8 | |||||||||
| 11:39:08PM | STOX50 | 5527.8 | |||||||||
| 11:44:19PM | GERMANY | 23184.8 | Success | ||||||||
| 11:48:02PM | US500 | 5838.1 | 5743 | 5711 | 5662 | 5804 | 5860 | 5891 | 5941 | 5820 | |
| 11:50:46PM | DOW | 42995.5 | |||||||||
| 11:53:31PM | NASDAQ | 20574.9 | |||||||||
| 11:56:48PM | JAPAN | 37733 |
5/03/2025 FTSE Closed at 8755 points. Change of -0.05%. Total value traded through LSE was: £ 7,203,655,204 a change of -19.84%
4/03/2025 FTSE Closed at 8759 points. Change of -1.26%. Total value traded through LSE was: £ 8,986,196,002 a change of 22.76%
3/03/2025 FTSE Closed at 8871 points. Change of 0.7%. Total value traded through LSE was: £ 7,320,378,637 a change of -49.26%
28/02/2025 FTSE Closed at 8809 points. Change of 0.61%. Total value traded through LSE was: £ 14,426,533,627 a change of 91.89%
27/02/2025 FTSE Closed at 8756 points. Change of 0.29%. Total value traded through LSE was: £ 7,518,268,288 a change of 21.01%
26/02/2025 FTSE Closed at 8731 points. Change of 0.73%. Total value traded through LSE was: £ 6,212,854,759 a change of -4.11%
25/02/2025 FTSE Closed at 8668 points. Change of 0.12%. Total value traded through LSE was: £ 6,478,870,440 a change of 6.36% 
SUCCESS above means both FAST & SLOW targets were met. ‘CESS means just the FAST target met and probably the next time it is exceeded, movement to the SLOW target shall commence.
Our commentary is in two sections. Immediately below are today’s updated comments. If our commentary remains valid, the share can be found in the bottom section which has a RED heading. Hopefully, this will mean you no longer need to flip back through previous reports. HYPERLINKS DISABLED IN THIS VERSION
Please remember, all prices are mid-price (halfway between the Buy and Sell). When we refer to a price CLOSING above a specific level, we are viewing the point where we can regard a trend as changing. Otherwise, we are simply speculating on near term trading targets. Our website is www.trendsandtargets.com.
UPDATE. We often give an initial and a secondary price. If the initial is exceeded, we still expect it to fall back but the next time the initial is bettered, the price should continue to the secondary. The converse it true with price drops.
We can be contacted at info@trendsandtargets.com. Spam filters set to maximum so only legit emails get through…
Section One – Outlook Updated Today. Click here for Section Two – Outlook Remains Valid shares
Click Epic to jump to share: LSE:AFC AFC Energy** **LSE:ASC Asos** **LSE:ECO ECO (Atlantic) O & G** **LSE:IHG Intercontinental Hotels Group** **LSE:LLOY Lloyds Grp.** **LSE:RR. Rolls Royce** **LSE:TLW Tullow** **
********
Updated charts published on : AFC Energy, Asos, ECO (Atlantic) O & G, Intercontinental Hotels Group, Lloyds Grp., Rolls Royce, Tullow,
LSE:AFC AFC Energy. Close Mid-Price: 7.4 Percentage Change: + 2.92% Day High: 7.01 Day Low: 6.11
Target met. If AFC Energy experiences continued weakness below 6.11, it w ……..
</p
View Previous AFC Energy & Big Picture ***
LSE:ASC Asos Close Mid-Price: 293.6 Percentage Change: -3.86% Day High: 315.4 Day Low: 295
Target met. Weakness on Asos below 295 will invariably lead to 287p with ……..
</p
View Previous Asos & Big Picture ***
LSE:ECO ECO (Atlantic) O & G. Close Mid-Price: 9.25 Percentage Change: + 0.00% Day High: 9.25 Day Low: 8.91
If ECO (Atlantic) O & G experiences continued weakness below 8.91, it wil ……..
</p
View Previous ECO (Atlantic) O & G & Big Picture ***
LSE:IHG Intercontinental Hotels Group Close Mid-Price: 9576 Percentage Change: -0.85% Day High: 9834 Day Low: 9548
If Intercontinental Hotels Group experiences continued weakness below 954 ……..
</p
View Previous Intercontinental Hotels Group & Big Picture ***
LSE:LLOY Lloyds Grp.. Close Mid-Price: 73.08 Percentage Change: + 2.32% Day High: 74.14 Day Low: 72.48
Further movement against Lloyds Grp. ABOVE 74.14 should improve accelerat ……..
</p
View Previous Lloyds Grp. & Big Picture ***
LSE:RR. Rolls Royce. Close Mid-Price: 805.2 Percentage Change: + 2.39% Day High: 815.4 Day Low: 796.2
Target met. All Rolls Royce needs are mid-price trades ABOVE 815.4 to imp ……..
</p
View Previous Rolls Royce & Big Picture ***
LSE:TLW Tullow Close Mid-Price: 13.93 Percentage Change: -1.76% Day High: 14.5 Day Low: 13.75
Continued weakness against TLW taking the price below 13.75 calculates as ……..
</p
View Previous Tullow & Big Picture ***