#Gold #SP500
It seemed a good idea to review the Travel Sector in conjunction with Easyjet, in the hope we’d finally spot some commonality of purpose. Inspiration wasn’t difficult to discover, thanks to the number of aliens appearing here in Argyll. It used to be the case “the roads were ours” until around the end of April but this year, things are very different. An easy example occurs daily, going for a dog walk in the local tree museum, a forest stocked with tree examples from around the globe.
There are multiple paths winding through the trees, the varied routes colour coded to denote difficulty. This month has seen locals emulate the deer, heading higher up the mountain to avoid the many visiting families with young children who’re tending to pollute the lower, easy paths. Few events are more irritating than an over-protective mother, anxious to keep her coddled children away from all the savage wild pet dogs, generally better behaved than these feral children. And the pollution from children is quite real, the lower paths already punctuated with lost gloves, lost hats, lost scarfs, even a lost pink romper suit. As for the parking area, the end of day witnesses a comedy of forgotten children’s single shoes and wellington boots, detritus of a successful day in the country…
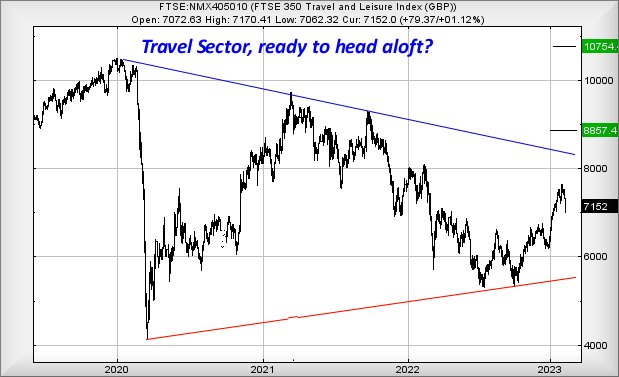
The point behind this little rant is a little obscure as we think there’s a disconnect between the Travel and Leisure index and the airline industry. The travel sector is doing okay, whereas many components relating to flying appear to be enjoying a struggle. If what’s happening here in Argyll is typical, domestic tourism appears more popular than international tourism and we should be dreading the summer months of May & June, when the West Coast of Scotland is usually sunniest, warmest, and driest.
For the Travel Sector, presently trading around 7150 points, it looks like it needs exceed 7790 to trigger recovery to 8857 points with secondary, if bettered, at 10754 and a challenge of the pre-Covid level of the market. We’re fairly optimistic this should be the case and in a normal environment, would suspect this should bode well for Easyjet.
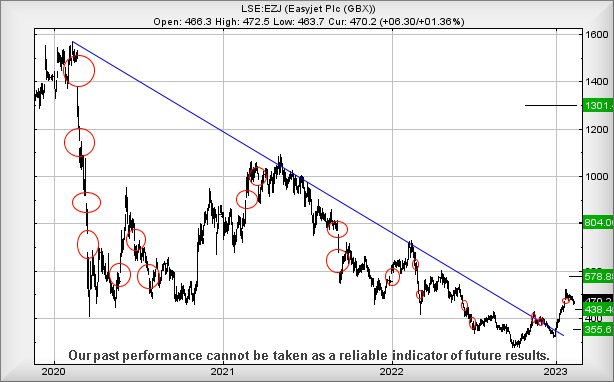
However, for Easyjet, we’re not quite as hopeful as there are major differences between the visuals on the charts.
Easyjet, for instance, managed to trade lower than the pandemic low, a feature which will suggest difficulty in recovering in the absence of a material change. The little poisonous Red Circles on the Easyjet chart catalogue numerous manipulation efforts since 2020, days when the market opted to Gap Down the share price at the open of trading. As can be seen, Gaps Up became a rarer event though, this year, there actually has been one fairly significant manipulation gap toward the end of January.
From a fairly near term perspective, EZJ need only exceed 490p as this should allegedly trigger slight recovery to an initial 578p. Our longer term secondary, should such a level be exceeded, works out at 804p. The major problem with each of these target levels, aside from not impressing us, is they fail to do anything other than exceed the immediate Blue downtrend since 2020. At present, nothing credible presents itself with the potential of share price movement of substance, challenging the historical pre-Covid high of almost 1600p.
Instead, despite a FTSE 100 painting higher all time highs, Easyjet currently looks struggling to become airborne. We’d guess the invading tourists here in Argyll are driving north, rather than avail themselves of the budget airline.
FUTURES
| Time Issued | Market | Price At Issue | Short Entry | Fast Exit | Slow Exit | Stop | Long Entry | Fast Exit | Slow Exit | Stop | Prior |
| 9:15:46PM | BRENT | 85.6 | Shambles | ||||||||
| 9:17:28PM | GOLD | 1854.46 | 1850 | 1843 | 1832 | 1859 | 1867 | 1874 | 1882 | 1853 | |
| 9:20:08PM | FTSE | 7966 | Success | ||||||||
| 9:27:03PM | STOX50 | 4258.8 | Success | ||||||||
| 9:29:59PM | GERMANY | 15436 | |||||||||
| 9:41:45PM | US500 | 4141 | 4068 | 4032 | 3977 | 4106 | 4142 | 4149 | 4181 | 4111 | Success |
| 9:44:25PM | DOW | 34254 | Success | ||||||||
| 10:02:18PM | NASDAQ | 12508 | ‘cess | ||||||||
| 10:05:03PM | JAPAN | 27706 |
13/02/2023 FTSE Closed at 7947 points. Change of 0.82%. Total value traded through LSE was: £ 4,663,265,889 a change of -40.31%
11/02/2023 FTSE Closed at 7882 points. Change of 0%. Total value traded through LSE was: £ 7,812,457,009 a change of 15.14%
10/02/2023 FTSE Closed at 7882 points. Change of -0.37%. Total value traded through LSE was: £ 6,785,335,053 a change of -4.85%
9/02/2023 FTSE Closed at 7911 points. Change of 0.33%. Total value traded through LSE was: £ 7,130,980,933 a change of 23.74%
8/02/2023 FTSE Closed at 7885 points. Change of 0.27%. Total value traded through LSE was: £ 5,763,001,863 a change of -1.93%
7/02/2023 FTSE Closed at 7864 points. Change of 0.36%. Total value traded through LSE was: £ 5,876,288,872 a change of 0.42%
6/02/2023 FTSE Closed at 7836 points. Change of -0.82%. Total value traded through LSE was: £ 5,851,906,357 a change of 5.01%
SUCCESS above means both FAST & SLOW targets were met. ‘CESS means just the FAST target met and probably the next time it is exceeded, movement to the SLOW target shall commence.
Our commentary is in two sections. Immediately below are today’s updated comments. If our commentary remains valid, the share can be found in the bottom section which has a RED heading. Hopefully, this will mean you no longer need to flip back through previous reports. HYPERLINKS DISABLED IN THIS VERSION
Please remember, all prices are mid-price (halfway between the Buy and Sell). When we refer to a price CLOSING above a specific level, we are viewing the point where we can regard a trend as changing. Otherwise, we are simply speculating on near term trading targets. Our website is www.trendsandtargets.com.
UPDATE. We often give an initial and a secondary price. If the initial is exceeded, we still expect it to fall back but the next time the initial is bettered, the price should continue to the secondary. The converse it true with price drops.
We can be contacted at info@trendsandtargets.com. Spam filters set to maximum so only legit emails get through…
Section One – Outlook Updated Today. Click here for Section Two – Outlook Remains Valid shares
Click Epic to jump to share: LSE:AZN Astrazeneca** **LSE:FRES Fresnillo** **LSE:NG. National Glib** **LSE:OPG OPG Power Ventures** **LSE:PMG Parkmead** **
********
Updated charts published on : Astrazeneca, Fresnillo, National Glib, OPG Power Ventures, Parkmead,
LSE:AZN Astrazeneca. Close Mid-Price: 11422 Percentage Change: + 0.28% Day High: 11466 Day Low: 11296
Further movement against Astrazeneca ABOVE 11466 should improve accelerat ……..
</p
View Previous Astrazeneca & Big Picture ***
LSE:FRES Fresnillo. Close Mid-Price: 794.4 Percentage Change: + 0.48% Day High: 796.8 Day Low: 785.2
Weakness on Fresnillo below 785.2 will invariably lead to 780 with second ……..
</p
View Previous Fresnillo & Big Picture ***
LSE:NG. National Glib. Close Mid-Price: 1054 Percentage Change: + 1.88% Day High: 1058 Day Low: 1037.5
All National Glib needs are mid-price trades ABOVE 1058 to improve accele ……..
</p
View Previous National Glib & Big Picture ***
LSE:OPG OPG Power Ventures Close Mid-Price: 6.4 Percentage Change: -3.03% Day High: 6.75 Day Low: 6.4
Continued trades against OPG with a mid-price ABOVE 6.75 should improve t ……..
</p
View Previous OPG Power Ventures & Big Picture ***
LSE:PMG Parkmead. Close Mid-Price: 45.3 Percentage Change: + 0.67% Day High: 44.5 Day Low: 43.4
If Parkmead experiences continued weakness below 43.4, it will invariably ……..
</p
View Previous Parkmead & Big Picture ***