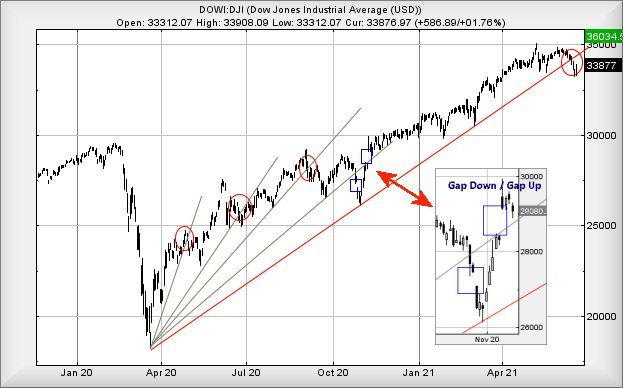
#Gold #SP500 The last 18 months certainly have proven interesting on the markets. The Dow Jones is particularly fascinating with movements since the lows of March 2020 teaching quite a few lessons in relation to chart movements. Not least, among the lessons, is a fairly important one. Uptrends, a trend line drawn across “lows” can be an utterly useless indicator. But of course, Lady Gaga also deserves a mention!
The chart below has 4 circled areas, highlighting when the immediate uptrend failed yet the market didn’t change direction. It’s often the case, when an uptrend breaks, it’s simply expressing a pause in a climb, rather than actually giving useful information. In-house, our favourite “tell” to spot false trend breaks comes, when the chart level exceeds the initial point of trend break.
For instance, in April last year, Wall St saw the trend break at 24,400 points. Immediately, the usual suspects were all over the media suggesting a false dawn from the Covid lows. Those same commentators were silent, when Wall St bettered 24,400 on May 18th 2020.
In June 2020, the market again caused panic, breaking below 25,800 points. Just 2 sessions later, it redeemed itself, moving above the point of trend break.
And in October/November 2020, Lady GaGa took to the stage. We’ve used two little blue boxes to highlight the puzzling movement. This, quite peculiar, series of manipulation is something we don’t get but we also dare not ignore. When a price is “Gapped Down” below a trend, then “Gapped Up”, it invariably suggests a share, commodity, or index, is about to experience some pretty solid growth. Importantly, the converse is also true, when the process is reversed and generally any ensuing price drop proves quite nasty.
For this particular type of instance, we’ve developed an acceleration theory, one which suggests the impetus imparted by the market manipulation in October 2020 should present a target level of 36,034 points eventually. We tend suspect, quite firmly, some volatility shall make itself known if the US market indeed reaches such a target level. Some folk dislike us choosing to refer to market gaps as ‘manipulation’ but when a price is moves, in complete absence of trades, it’s quite difficult to use any other term. In the case of Wall St, at some point before the market opened on October 28th last year, humans decided it was going to be worth 350 points less than the close the previous day.
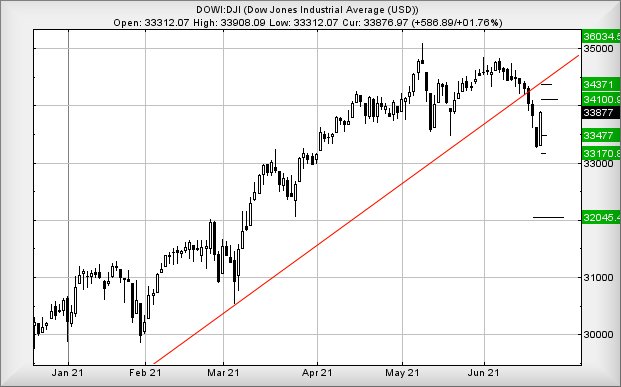
Finally, we come to movements from Wall St in the last couple of days. Our underlying expectation remains for this index to attempt the 36,000 point level, therefore don’t trust the immediate trend break. To confirm our sceptical belief, the market now needs recover above 34,225 points just to exceed the level at which the trend was broken. From an immediate standpoint, it’s relatively easy to present a scenario where this can occur.
Movement next above 33,910 points calculates with the potential of an initial 34,100 points. If bettered, our secondary works out at 34,370 points and comfortably rises above the point of trend break. As the market closed Monday at 33,877 points, it’s not a lot to ask for. And of course, our 36,000 ambition can once again be taken quite seriously.
Should things intend go horribly wrong for Wall St, the index needs below an immediate 33,640 points to justify a raised eyebrow. Breaking such a level will tend suggest the strength from Monday was perhaps false, capable of triggering reversal to an initial 33,477 points. A modest drop like this isn’t of special alarm but, if broken, our secondary works out at 33,170 points. This level of secondary is a real problem, taking the market into the realms of “lower lows” and perfectly capable of falling into the clutches of reversal down to 32,000 points.
At present, we remain fairly optimistic for the Dow Jones.

FUTURES
| Time Issued | Market | Price At Issue | Short Entry | Fast Exit | Slow Exit | Stop | Long Entry | Fast Exit | Slow Exit | Stop | Prior |
| 11:00:34PM | BRENT | 74.22 | Success | ||||||||
| 11:02:12PM | GOLD | 1783.24 | 1760 | 1754 | 1743 | 1779 | 1786 | 1792 | 1803 | 1772 | |
| 11:04:47PM | FTSE | 7090.87 | ‘cess | ||||||||
| 11:08:46PM | FRANCE | 6624.5 | ‘cess | ||||||||
| 11:11:18PM | GERMANY | 15651 | ‘cess | ||||||||
| 11:14:08PM | US500 | 4228.42 | 4170 | 4148 | 4120 | 4200 | 4231 | 4248.5 | 4264 | 4213 | ‘cess |
| 11:16:41PM | DOW | 33918 | Success | ||||||||
| 11:18:36PM | NASDAQ | 14144 | Shambles | ||||||||
| 11:21:53PM | JAPAN | 28737 |
21/06/2021 FTSE Closed at 7062 points. Change of 0.64%. Total value traded through LSE was: £ 5,402,713,223 a change of -54.05%
18/06/2021 FTSE Closed at 7017 points. Change of -1.9%. Total value traded through LSE was: £ 11,756,764,970 a change of 103.69%
17/06/2021 FTSE Closed at 7153 points. Change of -0.43%. Total value traded through LSE was: £ 5,772,023,987 a change of -2.72%
16/06/2021 FTSE Closed at 7184 points. Change of 0.17%. Total value traded through LSE was: £ 5,933,708,307 a change of 0.36%
15/06/2021 FTSE Closed at 7172 points. Change of 0.36%. Total value traded through LSE was: £ 5,912,147,960 a change of 2.11%
14/06/2021 FTSE Closed at 7146 points. Change of 0.17%. Total value traded through LSE was: £ 5,789,732,909 a change of 12.95%
11/06/2021 FTSE Closed at 7134 points. Change of 0.65%. Total value traded through LSE was: £ 5,126,105,822 a change of 3.18%
SUCCESS above means both FAST & SLOW targets were met. ‘CESS means just the FAST target met and probably the next time it is exceeded, movement to the SLOW target shall commence.
Our commentary is in two sections. Immediately below are today’s updated comments. If our commentary remains valid, the share can be found in the bottom section which has a RED heading. Hopefully, this will mean you no longer need to flip back through previous reports. HYPERLINKS DISABLED IN THIS VERSION
Please remember, all prices are mid-price (halfway between the Buy and Sell). When we refer to a price CLOSING above a specific level, we are viewing the point where we can regard a trend as changing. Otherwise, we are simply speculating on near term trading targets. Our website is www.trendsandtargets.com.
UPDATE. We often give an initial and a secondary price. If the initial is exceeded, we still expect it to fall back but the next time the initial is bettered, the price should continue to the secondary. The converse it true with price drops.
We can be contacted at info@trendsandtargets.com. Spam filters set to maximum so only legit emails get through…
Section One – Outlook Updated Today. Click here for Section Two – Outlook Remains Valid shares
Click Epic to jump to share: LSE:AML Aston Martin** **LSE:AVCT Avacta** **LSE:BARC Barclays** **LSE:BDEV Barrett Devs** **LSE:GLEN Glencore Xstra** **LSE:IGG IG Group** **LSE:IQE IQE** **LSE:MRW Morrisons** **LSE:ODX Omega Diags** **LSE:OXIG Oxford Instruments** **LSE:PMG Parkmead** **LSE:QFI Quadrise** **LSE:RBD Reabold Resources PLC** **LSE:SBRY Sainsbury** **LSE:SRP Serco** **LSE:TW. Taylor Wimpey** **
********
Updated charts published on : Aston Martin, Avacta, Barclays, Barrett Devs, Glencore Xstra, IG Group, IQE, Morrisons, Omega Diags, Oxford Instruments, Parkmead, Quadrise, Reabold Resources PLC, Sainsbury, Serco, Taylor Wimpey,
LSE:AML Aston Martin. Close Mid-Price: 1934.5 Percentage Change: + 2.44% Day High: 1951 Day Low: 1861
If Aston Martin experiences continued weakness below 1861, it will invari ……..
</p
View Previous Aston Martin & Big Picture ***
LSE:AVCT Avacta Close Mid-Price: 182 Percentage Change: -14.87% Day High: 217.5 Day Low: 174
Target met. Weakness on Avacta below 174 will invariably lead to 161 with ……..
</p
View Previous Avacta & Big Picture ***
LSE:BARC Barclays. Close Mid-Price: 172.94 Percentage Change: + 0.63% Day High: 173.2 Day Low: 167.98
Continued weakness against BARC taking the price below 167.98 calculates ……..
</p
View Previous Barclays & Big Picture ***
LSE:BDEV Barrett Devs. Close Mid-Price: 709.8 Percentage Change: + 0.28% Day High: 711.6 Day Low: 694.6
In the event Barrett Devs experiences weakness below 694.6 it calculates ……..
</p
View Previous Barrett Devs & Big Picture ***
LSE:GLEN Glencore Xstra. Close Mid-Price: 301.25 Percentage Change: + 1.24% Day High: 303 Day Low: 290.15
Weakness on Glencore Xstra below 290.15 will invariably lead to 271 with ……..
</p
View Previous Glencore Xstra & Big Picture ***
LSE:IGG IG Group. Close Mid-Price: 858.5 Percentage Change: + 1.54% Day High: 859.5 Day Low: 833
Continued weakness against IGG taking the price below 833 calculates as l ……..
</p
View Previous IG Group & Big Picture ***
LSE:IQE IQE Close Mid-Price: 45.75 Percentage Change: -3.99% Day High: 48.8 Day Low: 45.95
If IQE experiences continued weakness below 45.95, it will invariably lea ……..
</p
View Previous IQE & Big Picture ***
LSE:MRW Morrisons. Close Mid-Price: 240.2 Percentage Change: + 34.60% Day High: 240 Day Low: 228.1
Target met. All Morrisons needs are mid-price trades ABOVE 240 to improve ……..
</p
View Previous Morrisons & Big Picture ***
LSE:ODX Omega Diags Close Mid-Price: 55.5 Percentage Change: -5.93% Day High: 60 Day Low: 54
Target met. Weakness on Omega Diags below 54 will invariably lead to 50.5 ……..
</p
View Previous Omega Diags & Big Picture ***
LSE:OXIG Oxford Instruments Close Mid-Price: 2275 Percentage Change: -1.52% Day High: 2350 Day Low: 2235
In the event of Oxford Instruments enjoying further trades beyond 2350, t ……..
</p
View Previous Oxford Instruments & Big Picture ***
LSE:PMG Parkmead Close Mid-Price: 46 Percentage Change: -1.18% Day High: 46 Day Low: 45.5
Next above just 48p should give reasonable hope, calculating with an initi ……..
</p
View Previous Parkmead & Big Picture ***
LSE:QFI Quadrise. Close Mid-Price: 3.84 Percentage Change: + 1.59% Day High: 3.84 Day Low: 3.53
If Quadrise experiences continued weakness below 3.53, it will invariably ……..
</p
View Previous Quadrise & Big Picture ***
LSE:RBD Reabold Resources PLC Close Mid-Price: 0.56 Percentage Change: -6.72% Day High: 0.6 Day Low: 0.56
This is still looking dire as weakness below .56 still suggests travel dow ……..
</p
View Previous Reabold Resources PLC & Big Picture ***
LSE:SBRY Sainsbury. Close Mid-Price: 270.1 Percentage Change: + 3.84% Day High: 274.9 Day Low: 268
Target met. In the event of Sainsbury enjoying further trades beyond 274. ……..
</p
View Previous Sainsbury & Big Picture ***
LSE:SRP Serco Close Mid-Price: 131.7 Percentage Change: -0.30% Day High: 132.2 Day Low: 129.8
Continued weakness against SRP taking the price below 129.8 calculates as ……..
</p
View Previous Serco & Big Picture ***
LSE:TW. Taylor Wimpey. Close Mid-Price: 165 Percentage Change: + 2.68% Day High: 165.3 Day Low: 158.55
Target met. If Taylor Wimpey experiences continued weakness below 158.55, ……..
</p
View Previous Taylor Wimpey & Big Picture ***