Barclays for 1/05/2019

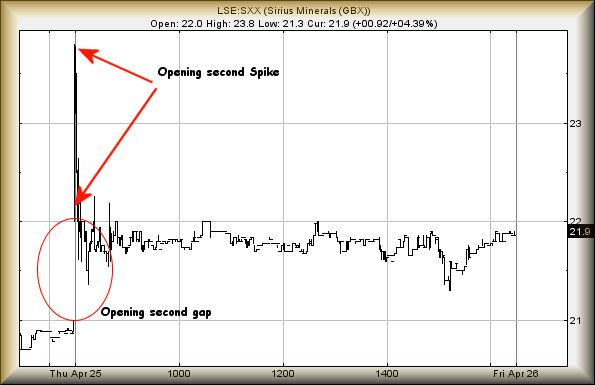
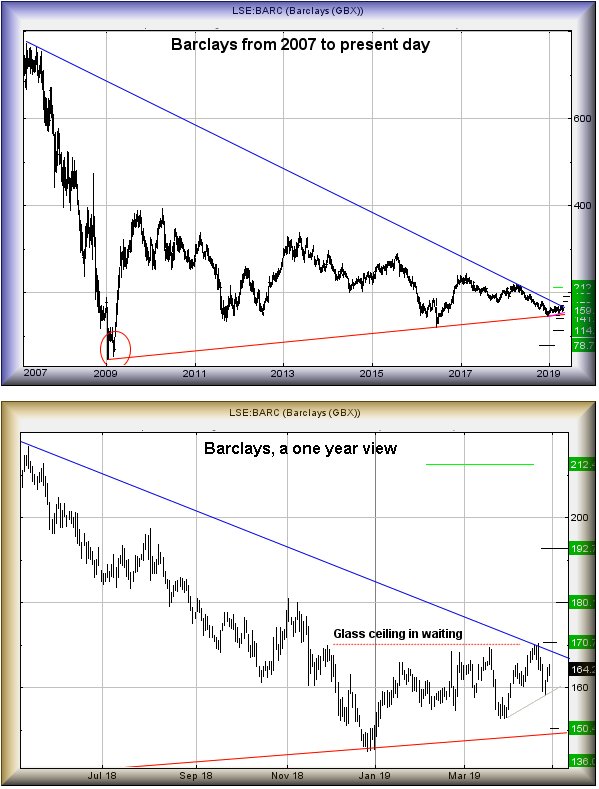
Barclays (LSE:BARC) #FTSE #SP500 We’re tempted to tear up our rule book against the retail banks. Despite bank shares pretending to be interesting, share prices have backed themselves into a corner, resulting in a situation where either sharp reversal shall be required or, more probably, logical trends broken but prices becoming rangebound.

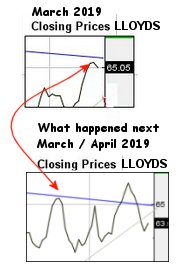
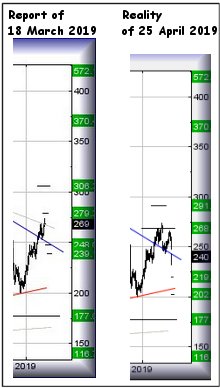
This was also our conclusion the other day, when reviewing Lloyds Group and there’s nothing about Barclays suggesting it shall prove different.

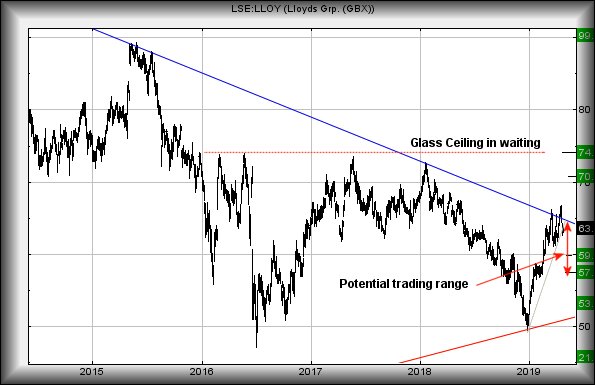
At present, the downtrend since June 2007, shown as BLUE on each chart, is at 168.49p. Normal rules demand a price close above this level before enthusiastically hoping for better times ahead. Barclays currently exhibits some indication for a rise as theoretically, now above 165p is supposed to bring recovery to an initial 170.75p. Movement such as this would give every hope the price shall close above the long term downtrend but the fly in the ointment – similar to Lloyds – is the presence of a “glass ceiling in waiting” around the 170p level, shown on the lower chart.

Visually, this creates a suspicion that, even with a trend break, Barclays intends oscillate between the 170p level and the 155p level until something resolves Brexit issues. Only with closure above the 170.75p level will we dare succumb to hope, giving an initial 180p ambition with secondary, if bettered, of 192p. Or more probably beyond.

Until such time the share price manages a solid movement, while it languishes below BLUE there’s the threat of weakness below 159p driving the price down to 150.5p. Extreme danger is possible with trades below the 150p level, due to “bottom” calculating at 136p.

In the event anything interesting happens, we should revisit the retails banks and refresh our Big Picture perspective, sometime in June.

FUTURES

FUTURES

Time Issued

Market

Price At Issue

Short Entry

Fast Exit

Slow Exit

Stop

Long Entry

Fast Exit

Slow Exit

Stop

Prior

9:59:41PM

BRENT

71.68


10:16:38PM

GOLD

1284.18


10:19:13PM

FTSE

7450.82

7391

7374.5

7346

7435

7456

7466.25

7477

7420

‘cess

10:32:16PM

FRANCE

5595


10:34:12PM

GERMANY

12370


10:43:02PM

US500

2953.12

2923

2912

2898

2944

2955

2960

2965

2933

Shambles

10:45:31PM

DOW

26646.3


‘cess

10:48:05PM

NASDAQ

7832.77


Success

10:50:12PM

JAPAN

22409


‘cess

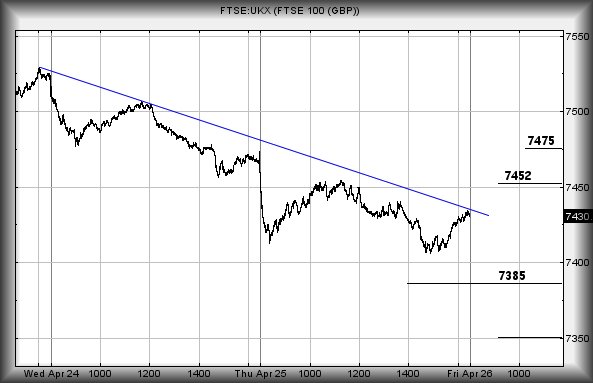
30/04/2019 FTSE Closed at 7418 points. Change of -0.3%.

Total value traded through LSE was: £ 6,143,157,298 a change of 41.83%

Lloyds for 30/04/2019

#GOLD #Nasdaq When we last reviewed Lloyds, we admitted considerable discomfort in projecting the shares future potentials (link here). Instead, we opted for the cowards route, suggesting it was probably going to be stuck in a state of flux until a Brexit solution appeared. Guess what, this appears to be the case!

As Lloyds share price “closing price” charts show, the share managed to briefly break trend with the market opting to stuff the share below BLUE. This tends confirm our suspicion the price will doubtless start some oscillation, ideally giving a trading range which will prove useful as we await politicians doing the job they are paid to do. It often feels the TV show, “The Apprentice” could do a better job of things, giving a bunch of publicity hungry hopefuls the task of managing a settlement with Europe.

If our suspicion is correct regarding Lloyds, weakness now below 63 should prove capable of reversal to an initial 60p. If broken, secondary is now calculating at 57.5p and remains a point at which we’d hope for a bounce. Theoretically – and visually – it will make sense for a bounce to head to 64p before again experiencing some reversals. This will give a reasonable trading range until Brexit nonsense is sorted, one way or another.

To adopt a tone which approaches optimism, Lloyds share price now requires trade above 67.8p, this apparently now permitting growth to an initial 70.75 with secondary, if bettered, a longer term 74p. Visually, there is an implication any rise foolish enough to hit the 74p level will find itself restricted by a glass ceiling which has existed since 2015. Only with closure above such a point will be genuinely adopt a stance of hope for the future.

FUTURES

Time Issued

Market

Price At Issue

Short Entry

Fast Exit

Slow Exit

Stop

Long Entry

Fast Exit

Slow Exit

Stop

Prior

9:43:37PM

BRENT

71.6


9:45:32PM

GOLD

1279.84

1277

1275.2

1270.6

1284

1286

1288.3

1291.8

1279

9:48:00PM

FTSE

7453.92


9:50:18PM

FRANCE

5587.5


‘cess

10:02:18PM

GERMANY

12334.24


10:04:07PM

US500

2941.37


‘cess

10:05:55PM

DOW

26585


‘cess

10:08:49PM

NASDAQ

7792.15

7789

7772.5

7746

7829

7852

7865.5

7908

7770

Shambles

10:10:26PM

JAPAN

22405


‘cess

29/04/2019 FTSE Closed at 7440 points. Change of 0.16%. Total value traded through LSE was: £ 4,331,228,714 a change of -31.26%

RBS for 29/04/2019

RBS #DAX #BRENT In the month since our last report, RBS share price has opted to disappoint everyone. It achieved our drop target (link here) and opted to break below 239p on the initial surge downward. For reasons given below, from our perspective this is a really bad thing, breaking every optimistic bone in our computer.

As regular readers know, over the years we’ve habitually given Primary and Secondary targets, our thinking being if a Primary is achieved, after the market has opted to mess around for a while at such a target level, it will eventually move UP or DOWN to the Secondary target – depending on whether any triggered scenario was for a Long or Short position. Eventually a fairly important penny dropped regarding our Primary target positions. Essentially, if a price breaks the Primary on its initial surge, the Secondary becomes almost assured. Whereas, if a price opts to spend a few hours teasing a target level but not breaking it, our Secondary position is on thin ice.

Quite why it took so many years for this to become apparent escapes us. It certainly explains some of our self congratulatory “Target Met – or near enough” results, these being price movements which fail to achieve their secondary levels but come within a spreads width of target.

Therefore, despite closing Friday at 240p, just above our 239p drop target, the share price of RBS achieved a day low of 232.5 and thus, we should prepare for the worse. The immediate situation suggests ongoing weakness below 232 should bring some reversal toward an initial 219.5p, followed by some sort of bounce. It will be worth watching for 219.5 being broken as “bottom”, the level from where a real bounce can be hoped, calculates at 202.5p.

On the chart below, we’ve a notional trend line, something which dates back 11 years to 2008. We call it notional, ‘cos we’ve not been convinced it’s a trend the market is paying attention to but the opening share price movement on Friday 26th tended confirm the trend was painfully real. The nice folk who manipulate prices opted to gap RBS rather precisely down below this BLUE line, meaning RBS share price requires close above 243p to escape its doom with a bottom at 202.5p (hopefully).

Only with closure above 243p dare we take the attitude of RBS heading to an initial 268 with secondary, if bettered, a longer term 291p.

FUTURES

Time Issued

Market

Price At Issue

Short Entry

Fast Exit

Slow Exit

Stop

Long Entry

Fast Exit

Slow Exit

Stop

Prior

4:34:46PM

BRENT

71.19

71

70.505

69.05

72.95

73.74

74.095

75.24

72.6

Success

4:36:47PM

GOLD

1286.25


‘cess

4:40:22PM

FTSE

7435


4:42:14PM

FRANCE

5568.7


4:48:04PM

GERMANY

12312

12234

12207

12168

12315

12325

12343

12379

12273

4:59:12PM

US500

2937.82


‘cess

5:01:09PM

DOW

26521.2


‘cess

5:03:03PM

NASDAQ

7823.02


‘cess

5:05:01PM

JAPAN

22325


‘cess

26/04/2019 FTSE Closed at 7428 points. Change of -0.08%.

Total value traded through LSE was: £ 6,300,902,502 a change of 16%

FTSE FRIDAY + Sirius for 26/04/2019

#DAX #Gold. The market evolve, causing us to evolve with them and constantly change our approach to future analysis. There are a few market ploys which remain constant (and despised), some movement ploys take a holiday for a year or two, and some new strategy appearing too.

Our most hated trading ploy is the spike. At the open of trade a share price will spike UP or DOWN, generally to one of our target levels. This price movement is usually untradeable unless the investor had the foresight to place an order. Worse, an upward spike is generally the harbinger for coming downward movement whereas the converse is true with a downward spike. The whole thing makes little sense and the waters become muddied, when a trading spike is combined with a price manipulation gap. Logic implies a “Gap Up” is the market attempting to impart energy for some future gains on a price. But a Spike Up implies a price is about to fall. Sirius Minerals managed to step forward and fill the poisonous chalice on the 24th April.

Based on the numbers alone, Sirius experienced quite a vibrant day for the share price, a trading range of 2.5p – 11.42% bandwidth. Unfortunately, a glance at what actually happened tells quite a different story. Three minutes after trading opened for the day, very little happened. The gullible optimists, probably glued to their screens from 8am, doubtless lost interest around lunchtime, painfully aware they’d been fed a teaser.

We’re also completely uncertain, due to the strategy of using two different indicators. Our gut feeling is SXX shall fall toward 19 again, prior to a rebound. But we’re also trying to ignore it closed at a “higher high (by just 0.04p)” than last time, something supposed to provide optimism.

As for the FTSE for FRIDAY, the market did something which (from our viewpoint) was quite interesting on Thursday by achieving a low of 7405 points. We’ve some mathematical mumbo jumbo around this figure but in plain English, below 7405 should indicate near term weakness coming to 7385 points. If broken, our secondary is at 7350 points.

The UK index achieved a fairly stage managed reversal during the last couple of sessions, one which promises above 7436 points at the open on Friday shall imply the reversal is complete and some recovery to 7452 can be anticipated. If bettered, secondary calculates at 7475 points.

We’re actually not comfortable the pristine BLUE downtrend actually means anything, instead suspecting the FTSE is liable to spend Friday hitting the 7452 level, then reverse yet again with 7385 making an appearance if any negative news appears.

On the bright side, Easter is thankfully over and we’ve absolutely no chocolate remaining in the office. I know, I searched – several times!

FUTURES

Time Issued

Market

Price At Issue

Short Entry

Fast Exit

Slow Exit

Stop

Long Entry

Fast Exit

Slow Exit

Stop

Prior

10:10:48PM

BRENT

73.71

73.4

72.975


74.4

74.73

74.99


73.88

Success

10:13:11PM

GOLD

1277.78

1273

1270.5


1280

1280

1286


1273

Success

10:21:14PM

FTSE

7445.84

7405

7389


7468

7468

7490.75


7435

Success

10:22:44PM

FRANCE

5570.7

5537

5518


5573

5574

5589.5


5542

‘cess

10:40:44PM

GERMANY

12288.96

12222

12185.5


12306

12331

12345.5


12268

10:42:21PM

US500

2920.32

2909

2898.5


2932

2933

2941.5


2919

Success

10:44:47PM

DOW

26423

26407

26377


26540

26547

26663


26408

Success

10:46:30PM

NASDAQ

7766.15

7763

7745


7834

7859

7876


7780

Shambles

10:52:19PM

JAPAN

22185

22172

22079


22280

22305

22351


22197

25/04/2019 FTSE Closed at 7434 points. Change of -0.5%. Total value traded through LSE was: £ 5,431,830,859 a change of -5.85%

Intel Corp for 25/04/2019

#CAC40 #Nasdaq There’s a certain brand loyalty which Intel generated. An abiding memory from early 1983, rushing back from Edinburgh, Scotland with an IBM XT computer, fitted with an Intel 8088 processor and a massive 10mb hard disk. This marked the start of a relationship with Intel processors which continues to this day.

The company, due to issue an earnings report on Thursday, appear to have a share price with some reasonable growth potentials.

From an immediate standpoint, apparently price movement now above 60 should bring continued growth to an initial 63. Slightly more interesting is our secondary calculation which comes in at 67 dollars. To be honest, the point at which the share closed on Wednesday (58.72) already makes travel to 67 seem a sensible conclusion.

Our perspective, using our software and attempting to mimic market software’ future price cycle, is slightly terrifying at this stage, due to the potential of a movement coming within 24 hours! Usually, we prefer some weeks or months in which to rehearse excuses!

For any trouble to be taken seriously, Intel requires to flop below 55, this looking capable of reversal to an initial 51. If broken, our secondary drop target calculates at 45.5. Neither drop potential is particularly life threatening as the price requires below 40 to break the immediate growth cycle and utterly trash its upward potentials.

We like Intel and, of course, the memory of that first “proper” PC with Intel Inside reminds of the original solid IBM keyboard. What the heck has happened to keyboards over the years? The quality and feel has declined and even our in-house choice, Microsoft Sculpt Office keyboards and mice rarely last longer than 18 months…

FUTURES

Time Issued

Market

Price At Issue

Short Entry

Fast Exit

Slow Exit

Stop

Long Entry

Fast Exit

Slow Exit

Stop

Prior

10:27:06PM

BRENT

73.92


10:42:39PM

GOLD

1276.34


10:44:57PM

FTSE

7467.94


10:47:50PM

FRANCE

5580.5

5557

5545

5527

5585

5600

5618.5

5639

5563

10:56:16PM

GERMANY

12309


Success

10:57:50PM

US500

2927.92


10:59:40PM

DOW

26546


Shambles

11:01:29PM

NASDAQ

7840.24

7781

7762

7736

7827

7841

7850

7873

7782

11:03:55PM

JAPAN

22191


24/04/2019 FTSE Closed at 7471 points. Change of -0.69%.

Total value traded through LSE was: £ 5,769,303,007 a change of -12.08%

Amazon for 24/04/2019 #Gold #SP500

As one of those folk who has a lot in common with Amazon, it made sense to review their potentials prior to results being released on Thursday. Of course, the “lot in common” is best expressed with a ridiculous self belief of being able to do anything, a character facet (flaw) which Amazon also exhibits as they attempt enter every field.

This self belief came to a crashing halt earlier today. Regular readers will recall mention of a love affair with my little red tractor. Amazon delivered a present in a large tube, several square meters of red Vinyl Wrap. The tractors bonnet had been growing rusty blisters under its paintwork and, having watched numerous shows on TV where car restorers easily employed Vinyl Wrap to cover multitudes of sins, my little tractor was about to be renewed to pristine condition.

Perhaps I should have remembered something important. I’m quite literally banned from wrapping presents at home, my wife preferring to be blindfolded and wearing gloves while she gift wraps anything I’ve bought her. All joking aside, both wife and daughter ensure I never wrap a gift, believing I’m in the pay of the sticky tape and wrapping paper industries. But surely self adhesive Vinyl Wrap could be easier? And a Hot Air gun during application would melt away any crimes…

Typing this, now with burnt fingers and a suspicious bald patch on my arm, the little red tractor sits on the lawn and looks quite dreadful. Quite honestly, I would have achieved a smoother, more visually pleasing, effect if I’d chosen to glue strips of bubble wrap onto the bonnet. Clearly, I cannot do anything and it makes me wonder if Amazon, once a reliable bookseller, will continue to produce positive results.

Will Amazon ever meet its Vinyl Wrap moment?

As the share price trundles on toward results day, we’re calculating a trigger level of 1979. To be fair, this is the initial target level with moves now above 1930 indicating the potential of 1979 making an appearance. Above this level and things get interesting, provoking 2206 as possible. This would present a new “all time high” for Amazon and take the share price into a region where a distant 2674 will be regarded as influencing price growth.

Essentially, the 2674 ambition will tend make positive news cause the share price to outperform, whereas negative news will tend underperform. Unless, of course, it’s really negative – a Vinyl Wrap moment!

If everything were to go wrong for Amazon, the share price needs move below the 1600 level. Visually something has been happening at this level until recently as now, below 1600 indicates coming weakness to 1245 initially. If broken, it should bottom around 996.

We suspect our calculation of 2206 shall prove viable, given share price performance this year.

FUTURES

Time Issued

Market

Price At Issue

Short Entry

Fast Exit

Slow Exit

Stop

Long Entry

Fast Exit

Slow Exit

Stop

Prior

9:16:43PM

BRENT

74.02


‘cess

9:20:04PM

GOLD

1272.7

1270

1265

1255

1280

1280

1282.5

1288

1271

Success

9:31:41PM

FTSE

7520


Success

9:50:30PM

FRANCE

5592.7


9:52:42PM

GERMANY

12251


9:58:57PM

US500

2935.37

2900

2889.5

2874

2921

2937

2941

2953

2909

Success

10:00:46PM

DOW

26651.9


‘cess

10:03:38PM

NASDAQ

7814.62


Success

10:05:23PM

JAPAN

22357


‘cess

Versarien for 23/04/2019

For some reason, Versarien always seems lend itself to a “what happened next” report, literally with each scenario we publish. Our last review on 2nd April (link here) illustrates a slightly worrying situation. Visually the rise came extremely close to our 145 target but importantly, it neither hit nor exceeded our ambition.

Common sense alone suggests some patience, after all the share has only made one attempt at the target level. Generally, a price will exhibit a fascination with such a target level for quite a few sessions, essentially flirting with the target price. Our worry comes from the fact 145p remained unsullied at the first surge upward, despite the share price being also manipulated (gapped) upward at the open. In addition, we had two quite distinct formula pointing to 145p as a pretty major point of interest. The fact the price (so far)  has avoiding this ambition perhaps implies weakness is present.

As a result, we’re inclined to look at reversal triggers before exploring future rise potentials.

The immediate threat is of weakness continuing below 130p bringing reversal down to an initial 122p.  In the grand scheme of things, this does not present a particularly nasty threat but our secondary, if such a level breaks, is down at 103p and risks reversal below the immediate downtrend. This tends to be a dangerous movement from a big picture perspective. In reality, we’d hope for a genuine bounce if 122p makes a guest appearance.

Due to our perception of the share as showing weakness, we now demand it better 149p before taking further rises seriously. A move such as this calculates with an initial potential of 165p. If exceeded, our secondary calculates as a less believable 198p – suspicious only because it exceeds the high of 2018, in doing so requiring an entirely new game plan for the longer term.

For now, we shall not be aghast to witness the price at 122p, prior to another chapter unfolding for Versarien.

FUTURES

18/04/2019 FTSE Closed at 7459 points. Change of -0.16%.

Total value traded through LSE was: £ 4,520,206,795 a change of -18.65%