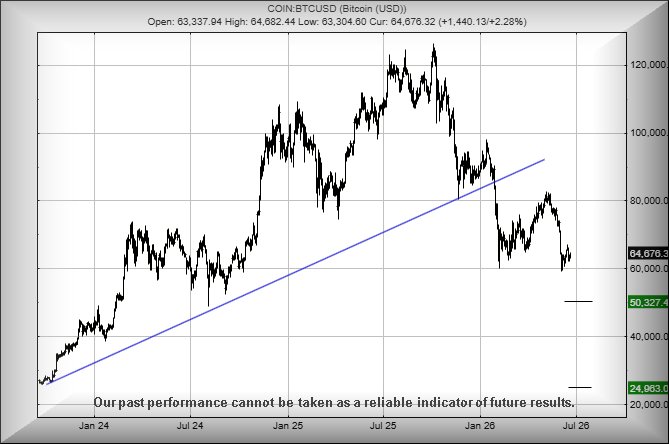
#Brent #Nasdaq The markets are proving a little crazy this year, perhaps even full on fruitcake. From a UK perspective, Share prices want to go up, some quite substantially. But Brent Crude wants to drop quite sharply, Gold often feels on the edge of a meltdown toward the $3k level, and CryptoCurrency only has itself to blame. Obviously, the Iran thing has focussed minds on just what is and is not a safe place to store your currency and Crypto, pretty conclusively, has been left wanting. In fact, should BitCoin manage to close a session below $63k, things risk becoming particularly nasty with a visit to the $50k level initially with our secondary looking absurd around $25k and a return to the levels of just 3 years ago.
Making things worse, Bitcoin has enacted a pretty neat Head & Shoulders movement formation since the start of 2025. The guy who theorised this to be a useful charting weapon calculated around $38k would be a typical outcome in the current scenario, our expectation around $25k is rather more painful, a result we anticipate to prove correct. Only if, of course, Bitcoin takes the final steps off the cliff. Like Scotland and their forthcoming match against Brazil, this crypto is on the edge, just waiting the right calamity circumstances. Scotland, on the other hand, only need walk onto a football pitch to face Brazil for calamity.
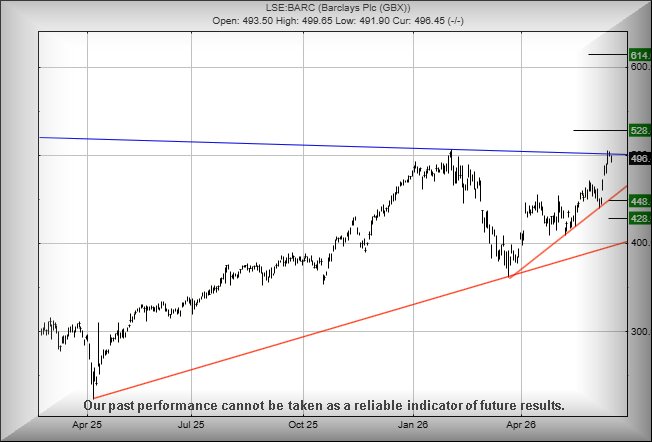
As for Barclays, their share price is doing fairly similar things to others in the banking sector. Essentially, there appears to be quite a lot of confidence (mostly hidden) which should flourish once the Iran shambles is complete. We couldn’t help but speculate the current Iranian walkout from “peace” talks may have something to do with softening oil prices. At least the Pakistan, Iranian, and American delegations can enjoy quality time in Bürgenstock, Switzerland, a place where great views were probably invented.
In the last few days, Barclays share price took a glance above the Blue downtrend since 2007, didn’t like what it saw and promptly retreated to the comparative safety below Blue. Generally, this sort of nonsense defines a share which, if it is going to move, will move fast. All it needs do is actually start going up!
Above 508p should provide a sane trigger to suggest proper movement is coming, this giving the “threat” of a visit to an initial 528p with our secondary for the longer term calculating at a less likely 614p.
If things intend go wrong for Barclays, their share price needs shuffle below Red at 460p currently, risking a visit down to an initial 448p. There is certainly hope for a near term bounce at such a level but our secondary, if it breaks, works out at a future 428p and the risk of the price getting stuck in mud for a while.
FUTURES
FUTURES
| Time Issued | Market | Price At Issue | Short Entry | Fast Exit | Slow Exit | Stop | Long Entry | Fast Exit | Slow Exit | Stop |
| 8:58:33PM | BRENT | 7971.6 | 7795 | 7538 | 7291 | 8280 | 8015 | 8164 | 8357 | 7898 |
| 9:00:55PM | GOLD | 4155.08 | ||||||||
| 9:03:07PM | FTSE | 10356.2 | ||||||||
| 9:06:40PM | STOX50 | 6275 | ||||||||
| 9:14:27PM | GERMANY | 24993.9 | ||||||||
| 9:18:10PM | US500 | 7490.4 | ||||||||
| 9:56:47PM | DOW | 51480.8 | ||||||||
| 10:18:39PM | NASDAQ | 30336.4 | 30080 | 29946 | 29774 | 30301 | 30410 | 30536 | 30849 | 30216 |
| 10:22:13PM | JAPAN | 71711 |

SUCCESS above means both FAST & SLOW targets were met. ‘CESS means just the FAST target met and probably the next time it is exceeded, movement to the SLOW target shall commence.
Our commentary is in two sections. Immediately below are today’s updated comments. If our commentary remains valid, the share can be found in the bottom section which has a RED heading. Hopefully, this will mean you no longer need to flip back through previous reports. HYPERLINKS DISABLED IN THIS VERSION
Please remember, all prices are mid-price (halfway between the Buy and Sell). When we refer to a price CLOSING above a specific level, we are viewing the point where we can regard a trend as changing. Otherwise, we are simply speculating on near term trading targets. Our website is www.trendsandtargets.com.
UPDATE. We often give an initial and a secondary price. If the initial is exceeded, we still expect it to fall back but the next time the initial is bettered, the price should continue to the secondary. The converse it true with price drops.
We can be contacted at info@trendsandtargets.com. Spam filters set to maximum so only legit emails get through…
Section One – Outlook Updated Today. Click here for Section Two – Outlook Remains Valid shares
Click Epic to jump to share: LSE:AML Aston Martin** **LSE:BARC Barclays** **LSE:HIK Hikma** **LSE:IPF International Personal Finance** **LSE:NG. National Glib** **
********
Updated charts published on : Aston Martin, Barclays, Hikma, International Personal Finance, National Glib,
LSE:AML Aston Martin. Close Mid-Price: 39.74 Percentage Change: + 0.00% Day High: 0 Day Low: 0
Weakness on Aston Martin below 39.74 will invariably lead to 37p and perh ……..
</p
View Previous Aston Martin & Big Picture ***
LSE:BARC Barclays. Close Mid-Price: 496.45 Percentage Change: + 0.00% Day High: 0 Day Low: 0
It’s still the case Barc needs above 506.3p to trigger useful movement, no ……..
</p
View Previous Barclays & Big Picture ***
LSE:HIK Hikma. Close Mid-Price: 1457 Percentage Change: + 0.00% Day High: 0 Day Low: 0
To indicate trouble, below 1308p risks triggering reversal down to an init ……..
</p
View Previous Hikma & Big Picture ***
LSE:IPF International Personal Finance. Close Mid-Price: 248.5 Percentage Change: + 0.00% Day High: 0 Day Low: 0
This needs above 258 to hopefully trigger an initial 328p with our seconda ……..
</p
View Previous International Personal Finance & Big Picture ***
LSE:NG. National Glib. Close Mid-Price: 1212 Percentage Change: + 0.00% Day High: 0 Day Low: 0
This is not looking good. Travel below 1175 risks triggering a visit to 10 ……..
</p
View Previous National Glib & Big Picture ***