#Brent #SP500 After a weekend of what often feels like “contrived” reporting, it appears clear the markets are determined to use the newest conflict to power a confusion of activity. Gold and Oil prices shall probably head upward while more fragile equities head down. If our guess about the artificial nature of reports proves correct, it will doubtless prove a viable opportunity to invest in “cheap” shares, when the media attention once again returns to internal USA turmoil where a serious war is being played out against the President Trump regime by the US media.
The crazy thing about current movements came from our headline comment below against the FTSE last Friday;

With the FTSE reaching a level above which we couldn’t comfortably calculate, we cannot express any surprise at the sudden turbulence from the Middle East as it very conveniently matches the need of the FTSE to bounce around for a while while designating some sort of new trend. This sort of banana shaped logic happens far too often for us to ignore and we really don’t understand why. On the US markets, when a ceiling approaches, it’s often the case the market discovers an excuse to “gap” the index up above a level we’ve perceived as problematic. With the UK market, some sort of artificial tantrum tends be the norm.
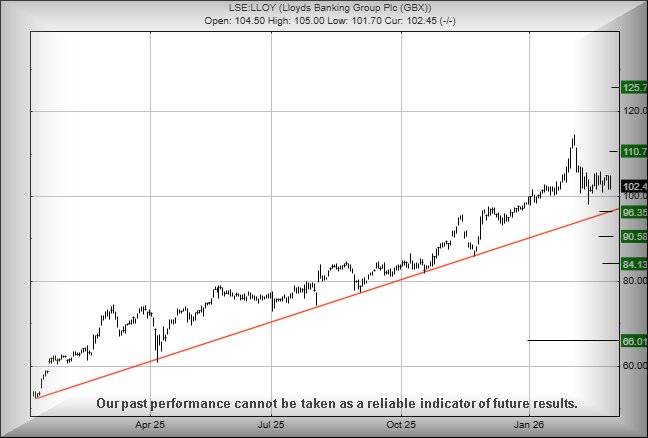
As for Lloyds, when we reviewed them three weeks ago, we speculated on the risk present, if the share price managed to stumble below 105.7p. This has occurred, the share price reaching our initial target of 99p before enacting one of the weakest bounces possible. Additionally, the drop stumbled below our 99p target, appearing to “bottom” at 98.2p yet only giving a 5p bounce. We’re not optimistic about the immediate future, suspecting near term weakness below 101 shall now make an attempt at 96 with our secondary, if broken, at a bottom of 90p. Or perhaps even 84p, if the market gets serious about reversals!
Our alternate scenario allows for above 107 to trigger recovery to an initial 110p with our secondary, if beaten, a more interesting 125p.
FUTURES
FUTURES
| Time Issued | Market | Price At Issue | Short Entry | Fast Exit | Slow Exit | Stop | Long Entry | Fast Exit | Slow Exit | Stop |
| 9:40:49PM | BRENT | 7311.3 | 7037 | 6910 | 6763 | 7162 | 7328 | 7377 | 7880 | 6921 |
| 9:42:34PM | GOLD | 5278.72 | ||||||||
| 9:45:05PM | FTSE | 10877.1 | ||||||||
| 9:46:47PM | STOX50 | 6106.2 | ||||||||
| 9:48:59PM | GERMANY | 25164.4 | ||||||||
| 9:51:08PM | US500 | 6864.9 | 6831 | 6821 | 6772 | 6878 | 6905 | 6930 | 6963 | 6873 |
| 10:47:25PM | DOW | 48879.3 | ||||||||
| 11:30:11PM | NASDAQ | 24909.3 | ||||||||
| 11:33:12PM | JAPAN | 57906 |
27/02/2026 FTSE Closed at 10910 points. Change of 0.59%. Total value traded through LSE was: £ 15,667,378,118 a change of 96.88%
26/02/2026 FTSE Closed at 10846 points. Change of 0.37%. Total value traded through LSE was: £ 7,957,799,956 a change of -7.62%
25/02/2026 FTSE Closed at 10806 points. Change of 1.18%. Total value traded through LSE was: £ 8,613,928,989 a change of 413.26%
24/02/2026 FTSE Closed at 10680 points. Change of -0.04%. Total value traded through LSE was: £ 1,678,265,417 a change of -75.91%
23/02/2026 FTSE Closed at 10684 points. Change of -0.02%. Total value traded through LSE was: £ 6,967,110,577 a change of -9.04%
20/02/2026 FTSE Closed at 10686 points. Change of 0.56%. Total value traded through LSE was: £ 7,659,209,162 a change of -16.29%
19/02/2026 FTSE Closed at 10627 points. Change of -0.55%. Total value traded through LSE was: £ 9,149,830,600 a change of 23.38% 
SUCCESS above means both FAST & SLOW targets were met. ‘CESS means just the FAST target met and probably the next time it is exceeded, movement to the SLOW target shall commence.
Our commentary is in two sections. Immediately below are today’s updated comments. If our commentary remains valid, the share can be found in the bottom section which has a RED heading. Hopefully, this will mean you no longer need to flip back through previous reports. HYPERLINKS DISABLED IN THIS VERSION
Please remember, all prices are mid-price (halfway between the Buy and Sell). When we refer to a price CLOSING above a specific level, we are viewing the point where we can regard a trend as changing. Otherwise, we are simply speculating on near term trading targets. Our website is www.trendsandtargets.com.
UPDATE. We often give an initial and a secondary price. If the initial is exceeded, we still expect it to fall back but the next time the initial is bettered, the price should continue to the secondary. The converse it true with price drops.
We can be contacted at info@trendsandtargets.com. Spam filters set to maximum so only legit emails get through…
Section One – Outlook Updated Today. Click here for Section Two – Outlook Remains Valid shares
Click Epic to jump to share: LSE:AML Aston Martin** **LSE:BT.A British Telecom** **LSE:GLEN Glencore Xstra** **LSE:HIK Hikma** **LSE:HSBA HSBC** **LSE:IAG British Airways** **LSE:NG. National Glib** **LSE:PMG Parkmead** **
********
Updated charts published on : Aston Martin, British Telecom, Glencore Xstra, Hikma, HSBC, British Airways, National Glib, Parkmead,
LSE:AML Aston Martin Close Mid-Price: 46.3 Percentage Change: -3.74% Day High: 48.9 Day Low: 44.9
Target met. If Aston Martin experiences continued weakness below 44.9, it ……..
</p
View Previous Aston Martin & Big Picture ***
LSE:BT.A British Telecom. Close Mid-Price: 216.8 Percentage Change: + 4.28% Day High: 217.2 Day Low: 206
All British Telecom needs are mid-price trades ABOVE 217.2 to improve acc ……..
</p
View Previous British Telecom & Big Picture ***
LSE:GLEN Glencore Xstra. Close Mid-Price: 534 Percentage Change: + 1.62% Day High: 539.7 Day Low: 529.6
Further movement against Glencore Xstra ABOVE 539.7 should improve accele ……..
</p
View Previous Glencore Xstra & Big Picture ***
LSE:HIK Hikma Close Mid-Price: 1314 Percentage Change: -4.30% Day High: 1374 Day Low: 1321
Continued weakness against HIK taking the price below 1321 calculates as ……..
</p
View Previous Hikma & Big Picture ***
LSE:HSBA HSBC Close Mid-Price: 1393.6 Percentage Change: -0.31% Day High: 1410.4 Day Low: 1377.8
Continued trades against HSBA with a mid-price ABOVE 1410.4 should improv ……..
</p
View Previous HSBC & Big Picture ***
LSE:IAG British Airways Close Mid-Price: 423.7 Percentage Change: -7.35% Day High: 464.1 Day Low: 422.5
All British Airways needs are mid-price trades ABOVE 464.1 to improve ac ……..
</p
View Previous British Airways & Big Picture ***
LSE:NG. National Glib. Close Mid-Price: 1391 Percentage Change: + 0.36% Day High: 1407.5 Day Low: 1377.5
All National Glib needs are mid-price trades ABOVE 1407.5 to improve acce ……..
</p
View Previous National Glib & Big Picture ***
LSE:PMG Parkmead. Close Mid-Price: 21 Percentage Change: + 2.44% Day High: 21 Day Low: 20.5
Target met. In the event of Parkmead enjoying further trades beyond 21, t ……..
</p
View Previous Parkmead & Big Picture ***