#Gold #Nasdaq If you take the price of Gold in US Dollars and divide it with the price of Silver in US Dollars, the resultant number can be currently rounded to 46. Or in plain English, Gold is 46 times the price of Silver which is apparently a little bit dodgy. It’s an interesting ratio, one which we’re not sure is entirely meaningful except in a surprise area. When the ratio wandered off in the opposite direction at various points during the 21st Century (so far), a spike was generally the precursor to some sort of contrived market tumble. When the ration hit 123 in 2020, we were exposed to the manufactured Covid-19 drop or, in 2008, it spiked to 85 before the market crash. Or in 2025, our pretty rubbish Christmas dinner was also prefaced by an upward spike in the Gold/Silver ratio.
While there’s a reasonable attempt to spin some fabric out of this ratio decreasing, we’re not convinced the number provides anything meaningful to keep an eye on. There’s an argument the long term average ratio stands at almost 70 and if this has any validity, it assumes we should anticipate Silver falling back down to the $73 level, always assuming Gold prices stay high. But should Silver fall into a sharp decline, it would certainly make some sense to divide the price of Gold by 70 to give yourself a target number for any short position.
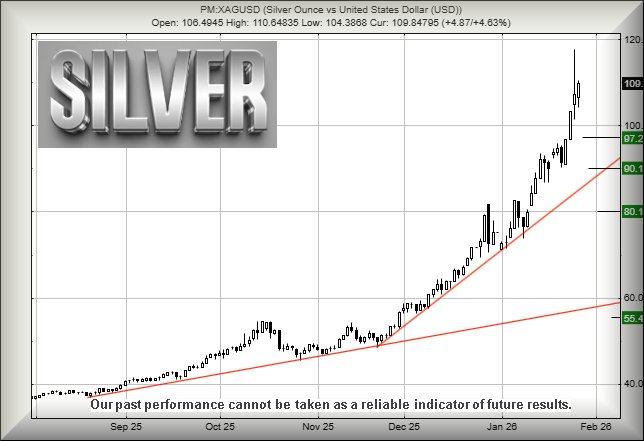
Silver is a problem for us. We cannot calculate potential high targets as it has spiralled above anything logical. If we apply the current ratio to prior upward spikes, using the logic above, the highest the price of Silver should be is $80. Broadly speaking, this matches our own sums, confirming anyone who claims to know “top” for Silver is probably talking out of their hat. We don’t have a clue, it’s outperforming, and we shall only be comfortable once some volatility appears. It is going to be worth remembering Bitcoin etc, the fake currency going higher than any logic allowed. While it has fallen back from above the 120,000 dollar level, it has also FAILED to slump below the prior low of 74k dollars, bobbling around like an inconvenient bit of potato which refused to make its way down the plughole.
In other words, it has become probable Bitcoin has defined a new trading range in the 74 to 120k area and any expectation of reversal to historical 20k levels is liable to be a disappointment!. In the case of Solver, reversal back toward a new “bottom” around $73/ounce shall make some sense.
When we throw our arguments at movements in the last week, we suspect movement below $101 for Silver risks triggering reversal to an initial $97 with our secondary, if broken, at $90 and potential bounce. In this instance, we can give a third level drop target at $80, marginally above our thoughts of a $73 level and thus, an ideal point for some sort of rebound. This would certainly tie in with an expectation for Silver to “do a Bitcoin”, defining a new trading range for itself and avoiding a tumble to lows which would be visually sane.
It’s all a bit weird as Silver isn’t like Gold, far easier to discover. Our own garden waterfall and stream, while being extremely parsimonious with Gold production, produces Silver with ease. Just not in anything approaching commercial quantities. Perhaps if the price of Silver shot up to the price levels achieved by Gold, our waterfall would be commercially viable but, to be fair, many more sources of Silver would suddenly spring into life.
For now, if Silver makes it above $118 per ounce, it will probably go up. As for how high, paying attention to the Entertainment section of the Daily Mirror may give an idea for targets but we can’t.
FUTURES
FUTURES
| Time Issued | Market | Price At Issue | Short Entry | Fast Exit | Slow Exit | Stop | Long Entry | Fast Exit | Slow Exit | Stop | Prior |
| 10:50:15PM | BRENT | 6483.8 | |||||||||
| 10:56:46PM | GOLD | 5010.08 | 4991 | 4971 | 4924 | 5037 | 5111 | 5132 | 5179 | 5080 | Success |
| 10:59:05PM | FTSE | 10149.9 | |||||||||
| 11:01:38PM | STOX50 | 5957.7 | |||||||||
| 11:04:30PM | GERMANY | 24917.7 | ‘cess | ||||||||
| 11:07:37PM | US500 | 6942.9 | ‘cess | ||||||||
| 11:12:19PM | DOW | 49222 | |||||||||
| 11:19:42PM | NASDAQ | 25735.3 | 25450 | 25332 | 25176 | 25610 | 25804 | 25900 | 26111 | 25698 | |
| 11:23:26PM | JAPAN | 52607 | ‘cess |
26/01/2026 FTSE Closed at 10148 points. Change of 0.05%. Total value traded through LSE was: £ 5,909,471,540 a change of -3.4%
23/01/2026 FTSE Closed at 10143 points. Change of -0.07%. Total value traded through LSE was: £ 6,117,563,035 a change of -17.66%
22/01/2026 FTSE Closed at 10150 points. Change of 0.12%. Total value traded through LSE was: £ 7,429,608,745 a change of -10.7%
21/01/2026 FTSE Closed at 10138 points. Change of 0.12%. Total value traded through LSE was: £ 8,319,716,543 a change of -14.69%
20/01/2026 FTSE Closed at 10126 points. Change of -0.68%. Total value traded through LSE was: £ 9,752,396,465 a change of 107.45%
19/01/2026 FTSE Closed at 10195 points. Change of -0.39%. Total value traded through LSE was: £ 4,701,087,965 a change of -48.92%
16/01/2026 FTSE Closed at 10235 points. Change of -0.03%. Total value traded through LSE was: £ 9,203,782,063 a change of 3.12% 
SUCCESS above means both FAST & SLOW targets were met. ‘CESS means just the FAST target met and probably the next time it is exceeded, movement to the SLOW target shall commence.
Our commentary is in two sections. Immediately below are today’s updated comments. If our commentary remains valid, the share can be found in the bottom section which has a RED heading. Hopefully, this will mean you no longer need to flip back through previous reports. HYPERLINKS DISABLED IN THIS VERSION
Please remember, all prices are mid-price (halfway between the Buy and Sell). When we refer to a price CLOSING above a specific level, we are viewing the point where we can regard a trend as changing. Otherwise, we are simply speculating on near term trading targets. Our website is www.trendsandtargets.com.
UPDATE. We often give an initial and a secondary price. If the initial is exceeded, we still expect it to fall back but the next time the initial is bettered, the price should continue to the secondary. The converse it true with price drops.
We can be contacted at info@trendsandtargets.com. Spam filters set to maximum so only legit emails get through…
Section One – Outlook Updated Today. Click here for Section Two – Outlook Remains Valid shares
Click Epic to jump to share: LSE:AAL Anglo American** **LSE:BLOE Block Energy PLC** **LSE:CNA Centrica** **LSE:EXPN Experian** **LSE:FRES Fresnillo** **LSE:GLEN Glencore Xstra** **LSE:NG. National Glib** **LSE:OXIG Oxford Instruments** **LSE:QED Quadrise** **LSE:VOD Vodafone** **
********
Updated charts published on : Anglo American, Block Energy PLC, Centrica, Experian, Fresnillo, Glencore Xstra, National Glib, Oxford Instruments, Quadrise, Vodafone,
LSE:AAL Anglo American. Close Mid-Price: 3448 Percentage Change: + 2.07% Day High: 3484 Day Low: 3378
In the event of Anglo American enjoying further trades beyond 3484, the s ……..
</p
View Previous Anglo American & Big Picture ***
LSE:BLOE Block Energy PLC. Close Mid-Price: 1.23 Percentage Change: + 26.29% Day High: 1.4 Day Low: 0.95
Target met. All Block Energy PLC needs are mid-price trades ABOVE 1.4 to ……..
</p
View Previous Block Energy PLC & Big Picture ***
LSE:CNA Centrica. Close Mid-Price: 184.6 Percentage Change: + 0.27% Day High: 186.15 Day Low: 183.3
In the event of Centrica enjoying further trades beyond 186.15, the share ……..
</p
View Previous Centrica & Big Picture ***
LSE:EXPN Experian Close Mid-Price: 2932 Percentage Change: -3.20% Day High: 3032 Day Low: 2901
Target met. Continued weakness against EXPN taking the price below 2901 c ……..
</p
View Previous Experian & Big Picture ***
LSE:FRES Fresnillo. Close Mid-Price: 4448 Percentage Change: + 6.72% Day High: 4470 Day Low: 4272
All Fresnillo needs are mid-price trades ABOVE 4188 to improve acceleratio ……..
</p
View Previous Fresnillo & Big Picture ***
LSE:GLEN Glencore Xstra Close Mid-Price: 500.1 Percentage Change: -0.18% Day High: 506.7 Day Low: 497.7
Further movement against Glencore Xstra ABOVE 506.7 should improve accele ……..
</p
View Previous Glencore Xstra & Big Picture ***
LSE:NG. National Glib. Close Mid-Price: 1204 Percentage Change: + 1.05% Day High: 1211.5 Day Low: 1194.5
All National Glib needs are mid-price trades ABOVE 1211.5 to improve acce ……..
</p
View Previous National Glib & Big Picture ***
LSE:OXIG Oxford Instruments. Close Mid-Price: 2525 Percentage Change: + 0.80% Day High: 2515 Day Low: 2470
In the event of Oxford Instruments enjoying further trades beyond 2515, t ……..
</p
View Previous Oxford Instruments & Big Picture ***
LSE:QED Quadrise Close Mid-Price: 2.31 Percentage Change: -3.95% Day High: 2.69 Day Low: 2.2
If Quadrise experiences continued weakness below 2.2, it will invariably ……..
</p
View Previous Quadrise & Big Picture ***
LSE:VOD Vodafone. Close Mid-Price: 104.55 Percentage Change: + 0.48% Day High: 105.55 Day Low: 103.85
Target met. Further movement against Vodafone ABOVE 105.55 should improve ……..
</p
View Previous Vodafone & Big Picture ***