#Nasdaq #Gold Just for a giggle, we’ve been once again messing around with our absurd time travel thoughts, remaining determined to “prove” when a share price should move to our target levels. There are two holy grails with prices and we’re happy we’ve gone as far as possible in our calculations for target levels. But the other part of the argument has always defeated, generally leaving us looking utterly incompetent in our own eyes. Of course, a history of incompetence doesn’t inhibit us making another go, trying out a further set of formula which “might” even work.
They won’t, we’re not Time Lords!
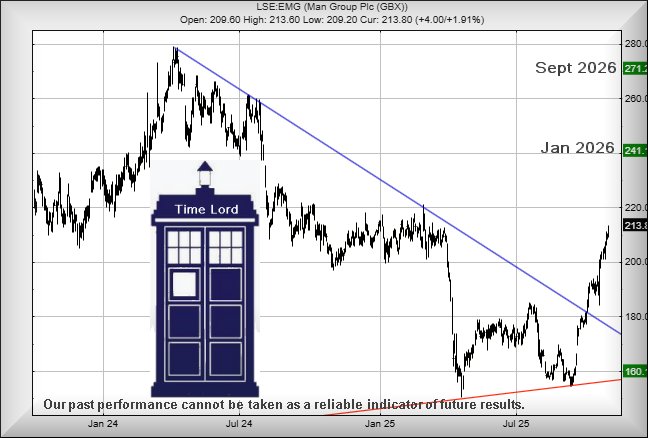
However, MAN Group share price movements since 2021 do lend themselves to another experiment with time travel, due to price movements successfully managing to meet our timing calculations with the result, another attempt at self flagellation was called for. As always, we shall look forward to a bunch of email reminders, if this goes horribly wrong. As usual, mainly because we still don’t accept things happen within specific timeframes, though there is some evidence to the contrary.
When we throw our timeframe logic at MAN, apparently we should anticipate it visiting 241p sometime around the middle of next January. Our longer term secondary, calculating at a future 271p, should apparently occur in mid-September next year. To be honest, we’ve printed this out and pinned it to the wall, a reminder to award ourselves a pat on the back. Or more probably, a self inflicted knife wound!
Our generally more successful price mapping currently suggests above 216p should trigger movement to 241 with our longer term secondary, if exceeded, calculating at 271p. While lacking the panache of our time travel formula, we still think it safer to promote our traditional way of looking at things, despite the level of patience being required. But it’s less open to ridicule than daring suggest 241p should appear around 16th January, 2026. Gosh, we’ll be in big trouble if any of this timeframe methodology actually works out.
If things intend go wrong, below 181p would promote trouble, along with reversal to 160 and a very possible bounce.
FUTURES
FUTURES
| Time Issued | Market | Price At Issue | Short Entry | Fast Exit | Slow Exit | Stop | Long Entry | Fast Exit | Slow Exit | Stop | Prior |
| 10:31:53PM | BRENT | 6424.6 | |||||||||
| 10:35:27PM | GOLD | 3932.84 | 3916 | 3885 | 3836 | 3966 | 4032 | 4072 | 4134 | 4001 | |
| 11:39:55PM | FTSE | 9742.9 | |||||||||
| 11:42:38PM | STOX50 | 5698.6 | ‘cess | ||||||||
| 11:44:59PM | GERMANY | 24116.4 | ‘cess | ||||||||
| 11:47:17PM | US500 | 6879.2 | Shambles | ||||||||
| 11:50:26PM | DOW | 47564.5 | Shambles | ||||||||
| 11:55:09PM | NASDAQ | 26075.7 | 25907 | 25856 | 25776 | 26010 | 26236 | 26389 | 26470 | 26000 | Success |
| 11:57:49PM | JAPAN | 51079 |
29/10/2025 FTSE Closed at 9756 points. Change of 0.62%. Total value traded through LSE was: £ 6,121,713,518 a change of 7.72%
28/10/2025 FTSE Closed at 9696 points. Change of 0.45%. Total value traded through LSE was: £ 5,683,126,613 a change of 7.14%
27/10/2025 FTSE Closed at 9653 points. Change of 0.08%. Total value traded through LSE was: £ 5,304,536,727 a change of 2.03%
24/10/2025 FTSE Closed at 9645 points. Change of 0.7%. Total value traded through LSE was: £ 5,198,860,657 a change of 1.36%
23/10/2025 FTSE Closed at 9578 points. Change of 0.66%. Total value traded through LSE was: £ 5,128,914,273 a change of -30.05%
22/10/2025 FTSE Closed at 9515 points. Change of 0.94%. Total value traded through LSE was: £ 7,332,238,538 a change of 33.6%
21/10/2025 FTSE Closed at 9426 points. Change of 0.24%. Total value traded through LSE was: £ 5,488,291,268 a change of 12.47% 
SUCCESS above means both FAST & SLOW targets were met. ‘CESS means just the FAST target met and probably the next time it is exceeded, movement to the SLOW target shall commence.
Our commentary is in two sections. Immediately below are today’s updated comments. If our commentary remains valid, the share can be found in the bottom section which has a RED heading. Hopefully, this will mean you no longer need to flip back through previous reports. HYPERLINKS DISABLED IN THIS VERSION
Please remember, all prices are mid-price (halfway between the Buy and Sell). When we refer to a price CLOSING above a specific level, we are viewing the point where we can regard a trend as changing. Otherwise, we are simply speculating on near term trading targets. Our website is www.trendsandtargets.com.
UPDATE. We often give an initial and a secondary price. If the initial is exceeded, we still expect it to fall back but the next time the initial is bettered, the price should continue to the secondary. The converse it true with price drops.
We can be contacted at info@trendsandtargets.com. Spam filters set to maximum so only legit emails get through…
Section One – Outlook Updated Today. Click here for Section Two – Outlook Remains Valid shares
Click Epic to jump to share: LSE:BARC Barclays** **LSE:BP. BP PLC** **LSE:EMG MAN** **LSE:GLEN Glencore Xstra** **LSE:HSBA HSBC** **LSE:LLOY Lloyds Grp.** **LSE:NWG Natwest** **LSE:QED Quadrise** **LSE:SMT Scottish Mortgage Investment Trust** **LSE:STAN Standard Chartered** **
********
Updated charts published on : Barclays, BP PLC, MAN, Glencore Xstra, HSBC, Lloyds Grp., Natwest, Quadrise, Scottish Mortgage Investment Trust, Standard Chartered,
LSE:BARC Barclays. Close Mid-Price: 405.05 Percentage Change: + 0.15% Day High: 408.5 Day Low: 403.4
Target met. All Barclays needs are mid-price trades ABOVE 408.5 to improv ……..
</p
View Previous Barclays & Big Picture ***
LSE:BP. BP PLC. Close Mid-Price: 441.55 Percentage Change: + 1.81% Day High: 442.1 Day Low: 433.5
Continued trades against BP. with a mid-price ABOVE 442.1 should improve ……..
</p
View Previous BP PLC & Big Picture ***
LSE:EMG MAN. Close Mid-Price: 213.8 Percentage Change: + 1.91% Day High: 213.6 Day Low: 209.2
Further movement against MAN ABOVE 213.6 should improve acceleration towa ……..
</p
View Previous MAN & Big Picture ***
LSE:GLEN Glencore Xstra. Close Mid-Price: 371.25 Percentage Change: + 5.63% Day High: 377.05 Day Low: 367.65
Target met. All Glencore Xstra needs are mid-price trades ABOVE 378p to i ……..
</p
View Previous Glencore Xstra & Big Picture ***
LSE:HSBA HSBC. Close Mid-Price: 1073.4 Percentage Change: + 2.21% Day High: 1073.4 Day Low: 1056.2
Target met. Continued trades against HSBA with a mid-price ABOVE 1073.4 s ……..
</p
View Previous HSBC & Big Picture ***
LSE:LLOY Lloyds Grp.. Close Mid-Price: 88.58 Percentage Change: + 0.82% Day High: 88.92 Day Low: 87.8
Further movement against Lloyds Grp. ABOVE 88.92 should improve accelerat ……..
</p
View Previous Lloyds Grp. & Big Picture ***
LSE:NWG Natwest. Close Mid-Price: 585.4 Percentage Change: + 0.55% Day High: 588.8 Day Low: 581
Further movement against Natwest ABOVE 588.8 should improve acceleration ……..
</p
View Previous Natwest & Big Picture ***
LSE:QED Quadrise Close Mid-Price: 3 Percentage Change: -3.23% Day High: 3.01 Day Low: 2.9
Weakness on Quadrise below 2.9 will invariably lead to 2.3 with secondary ……..
</p
View Previous Quadrise & Big Picture ***
LSE:SMT Scottish Mortgage Investment Trust. Close Mid-Price: 1174 Percentage Change: + 0.95% Day High: 1179 Day Low: 1163.5
In the event of Scottish Mortgage Investment Trust enjoying further trade ……..
</p
View Previous Scottish Mortgage Investment Trust & Big Picture ***
LSE:STAN Standard Chartered. Close Mid-Price: 1516 Percentage Change: + 1.07% Day High: 1522.5 Day Low: 1499.5
Target met. All Standard Chartered needs are mid-price trades ABOVE 1522. ……..
</p
View Previous Standard Chartered & Big Picture ***