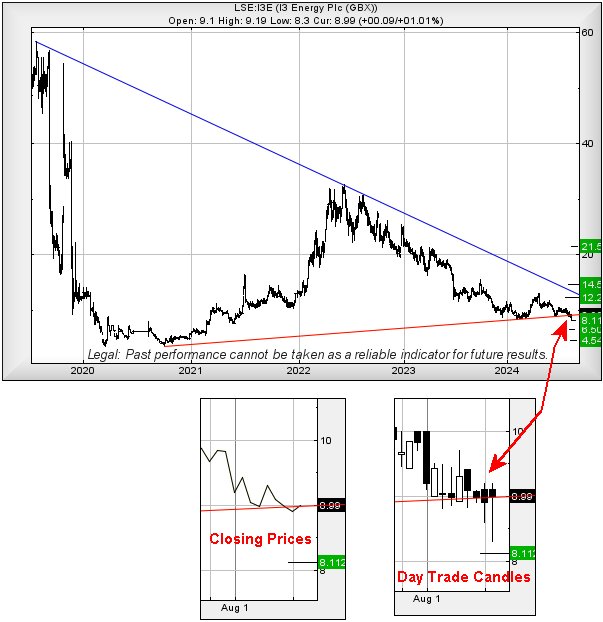
#Gold #Nasdaq There’s been a reasonable amount of positive coverage regarding I3 Energy recently, prompting a few emails asking where we think their share price might be going. The company, listed on the Toronto exchange, along with the London AIM market, certainly has a share price which looks a little confused, as highlighted on the two chart extracts below. The closing price for Monday bothers us, the market somehow deciding the share was going to end the session at just 8.9p. This visually brought a break of the uptrend since 2020 and it’s something we’d usually be quite concerned about, a share price being “allowed” to close above or below a trend line usually providing a major excuse to tick a box for direction.
However… something quite interesting also happened on Tuesday, the share price being spiked down to an odd 8.3p in early trades, a movement which caught our attention as a potential “bottom” had calculated at 8.11p. This brief dip didn’t hit our bottom potential, perhaps giving an early signal some hidden strength was present. In addition, it created a scenario where the share value now need only exceed 9.3p (please, not with a mystery upward spike) to carry the threat of real imminent price growth.
Essentially, movement above 9.3p should now be capable of triggering recovery to an initial 12.2p, testing the downward trend since 2019. If exceeded, our secondary works out at a future 14.5p, a price level where closure shall be necessary to tick a major box which lays out a path to a future 21.5p! Therefore, we’re taking the unusual step of looking positively at a trend break.
However, the market has teeth, though we’d prefer to regard our 8.11p as providing the next trigger level, one capable of provoking reversal to an initial 6.5 with secondary, if broken, at 4.5p and a price level below which we cannot calculate. It’ll maybe be worth doing some research into this lot as “something” looks very capable of happening with their share price.
FUTURES
| Time Issued | Market | Price At Issue | Short Entry | Fast Exit | Slow Exit | Stop | Long Entry | Fast Exit | Slow Exit | Stop | Prior |
| 11:31:28PM | BRENT | 8072.7 | |||||||||
| 11:37:56PM | GOLD | 2464.28 | 2460 | 2453 | 2445 | 2470 | 2478 | 2495 | 2542 | 2452 | |
| 11:41:02PM | DOW | 39741 | |||||||||
| 11:44:21PM | FTSE | 8247.7 | |||||||||
| 11:50:26PM | STOX50 | 4704.7 | |||||||||
| 11:53:13PM | GERMANY | 17849.7 | ‘cess | ||||||||
| 12:22:41AM | US500 | 5431.4 | ‘cess | ||||||||
| 12:26:37AM | NASDAQ | 19015.7 | 18542 | 18336 | 18106 | 18723 | 19030 | 19084 | 19696 | 18868 | ‘cess |
| 12:31:26AM | JAPAN | 36516 | ‘cess |