#FTSE, #DOW, #DAX, #Nasdaq, #Gold, #Brent This isn’t one of these reports where we compare the FTSE with everywhere else, then conclude the UK market is pretty rubbish. In the tradition of pictures speaking a 1,000 words, the charts below should provide sufficient clues and, in any case, the main objective of this analysis is to spot potential danger levels on each market, a trading level where all the negative guff spoken by market ‘experts’ might just have a point.
We entered 2023 with these ‘experts’ agreeing on just one thing, some serious recessionary times were ahead worldwide. Despite often feeling our own stance is usually negative, our outlook for 2023 differed as it looked like the experts would once again be wrong. When the BoE corrected its stance fairly early in the year, the sound of backpedalling proved fairly humorous, echoing from Forbes to Bloomberg to the FT in London. We’ve chosen the Pandemic Drop of 2020 as our starting point, a concept which makes some sense as it was the last time the markets internationally were obviously manipulated to create a panic scenario.
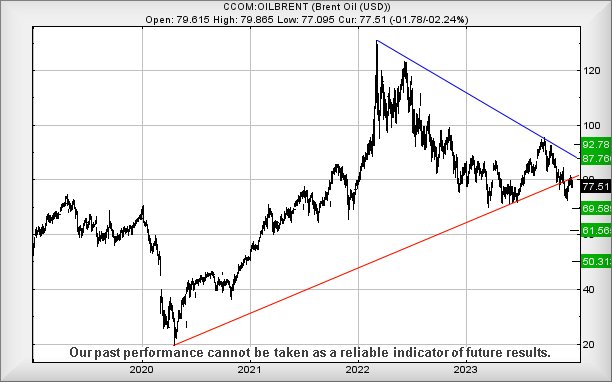
If we now choose to review Brent Crude, things don’t look great for the product price as it’s now trading in a region where some fairly strong reversals look possible. We regard $71.20 as the last straw to promote some fairly firm drops, indicating it will trigger reversal to an initial 69.5 with our “longer term” secondary, if broken, working out at 61.5 and the potential for a bounce. But if everything goes seriously wrong, it could easily choose to bounce from the $50 level eventually. If Brent intends to produce some miracles, above just 81.8 should do it, calculating with the hope of a visit to 87.7 with secondary,. if beaten, at 92.7 and probable hesitation.
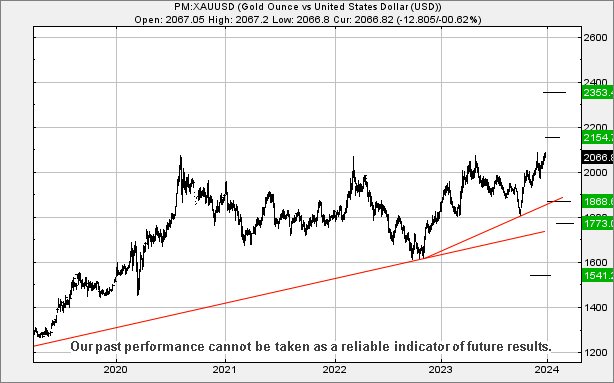
Gold, or as its friends now call it; XAU/USD, is in an interesting situation. The price of the metal has started to achieve “higher highs” and not just with unusual looking intraday spikes with don’t last very long. Instead, the metal is cheerfully closing sessions in positive territory. While we shall not be aghast if it tumbles back to around $2050 sometime in the weeks ahead, overall we’re fairly optimistic and shall not be surprised at future moves above 2090 promoting a lunge at 2154 dollars with our secondary, if bettered, working out at an eventual 2350 dollars. For the metal to attempt a melt down, the early “safe” sign looks like movement below 1916 triggering reversal to 1868 with secondary, if broken, at 1773 and a possible rebound.
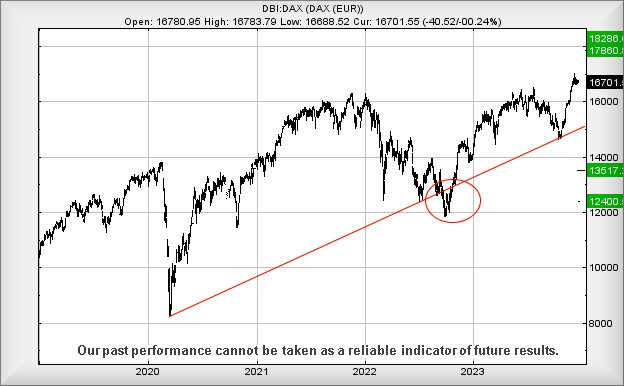
The Dax. The German market continues to look fairly positive, almost trading at its highest level of all time, an accolade achieved in the middle of this December. Despite the immediate price flatlining a bit currently, doubtless due to seasonal boredom factors, the German index would currently need slip below 15400 points to provoke a raised eyebrow for the future as this risks the start of an eventual 2000 point drop!
Its potentials currently look reasonably strong, above 17003 calculating with the hope of a visit to an initial 17860 with our secondary, if bettered, an eventual 18280 points.
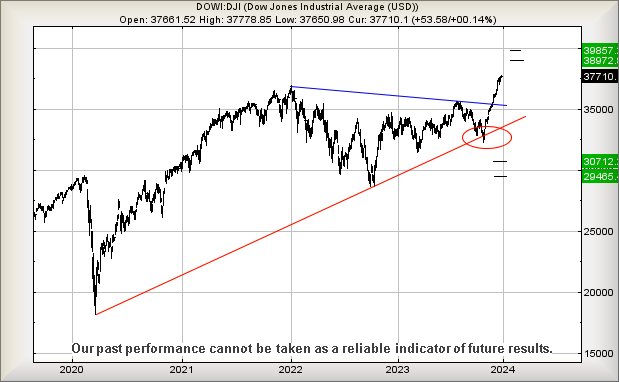
Dow Jones Our next member of the “Higher High” club is Wall St, gleefully soaring over all previous highs and despite the seasonal lack of volumes, continuing to climb on a daily basis. From our perspective, something fairly interesting is going on as it should “only” have climbed to 37500 and experienced some jitters. The reversal on December 20th appeared to deliver a quick ration of jitters and the days since continue to show relentless growth. It’s easily possible a near term 38215 calculates as possible on the immediate cycle, again a point at which some hesitation may occur. However, overall we now regard this as on a track to a longer term 38970 with secondary 39850, a level where is almost must experience hesitation of some sort.
For things to go pear shaped, below 33900 would be troubling, allowing reversals to an initial 30710 with secondary, if broken, around 29460 and a probable bounce.
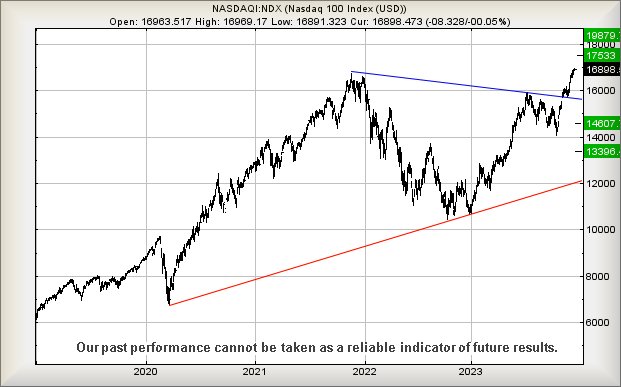
Nasdaq 100 The Nasdaq, despite its sojourn in the land of Higher Highs, is a bit of a puzzle. We’ve been calculating the 17000 level as holding the potential for some hesitation and the market has not yet exceeded such a level. Instead, it climbed to 16970 and doubtless has fallen victim to the lack of trading volume over the festive season. But our preference is always for a target level to be exceeded before uttering genuine optimism. Above 17000 points works out with an initial possibility of 17500 with secondary, if bettered, at an eventual top of 19800 points. It’s quite sobering to glance at the Nasdaq and view the 2020 Pandemic droop, remembering the uncertainty as to how long it’d take for the markets to recover.
If things intend go wrong, below 15100 would tick the first important box for trouble as this risks reversals to 14600 with secondary, if broken, at 13400 points.
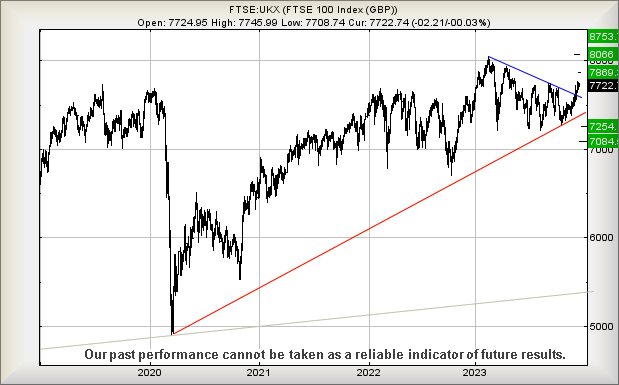
FTSE 100 With almost comic timing, the FTSE is managing to achieve its own version of ‘Higher Highs’ though instead of beating prior years, it’s only beating the months since June 2023. We’ve a “big deal” calculation for the future as the FTSE now needs better 8076 points to give a solid suggestion growth shall actually stick. From a near term perspective, above 7763 should now trigger movement to an initial 7869 points with secondary, if bettered, still at 8066 points and marginally below the level of breakout we demand for the longer term.
Should UK politics decide to wield its influence, below 7480 currently risks provoking reversal to an initial 7254 with secondary, if broken, at 7084 and hopefully a bottom.
Have a good New Year and our best wishes for a better 2024
FUTURES
| Time Issued | Market | Price At Issue | Short Entry | Fast Exit | Slow Exit | Stop | Long Entry | Fast Exit | Slow Exit | Stop | Prior |
| 9:30:12PM | BRENT | 7736 | 7710 | 7676 | 7520 | 7750 | 7914 | 7988 | 8082 | 7818 | Success |
| 9:32:45PM | GOLD | 2065.79 | 2065 | 2058 | 2048 | 2076 | 2081 | 2087 | 2095 | 2071 | |
| 9:35:37PM | FTSE | 7721 | 7705 | 7696 | 7675 | 7729 | 7743 | 7751 | 7765 | 7719 | |
| 9:38:32PM | STOX50 | 4516.7 | 4512 | 4508 | 4493 | 4526 | 4530 | 4534 | 4541 | 4520 | ‘cess |
| 10:11:42PM | GERMANY | 16707 | 16689 | 16669 | 16621 | 16740 | 16740 | 16752 | 16773 | 16710 | ‘cess |
| 10:14:38PM | US500 | 4787 | 4781 | 4776 | 4770 | 4790 | 4794 | 4796 | 4801 | 4787 | |
| 10:18:18PM | DOW | 37717 | 37542 | 37517 | 37429 | 37662 | 37779 | 37798 | 37825 | 37680 | ‘cess |
| 10:21:39PM | NASDAQ | 16900.7 | 16891 | 16869 | 16835 | 16923 | 16965 | 16984 | 17015 | 16919 | ‘cess |
| 10:24:26PM | JAPAN | 33432 | 33294 | 33082 | 32850 | 33396 | 33573 | 33699 | 33833 | 33488 | ‘cess |
28/12/2023 FTSE Closed at 7722 points. Change of -0.03%. Total value traded through LSE was: £ 2,663,363,582 a change of -25.61%
27/12/2023 FTSE Closed at 7724 points. Change of 0.35%. Total value traded through LSE was: £ 3,580,231,157 a change of 59.88%
22/12/2023 FTSE Closed at 7697 points. Change of 0.04%. Total value traded through LSE was: £ 2,239,365,244 a change of -44.7%
21/12/2023 FTSE Closed at 7694 points. Change of -0.27%. Total value traded through LSE was: £ 4,049,214,798 a change of -30.21%
20/12/2023 FTSE Closed at 7715 points. Change of 1.01%. Total value traded through LSE was: £ 5,802,090,818 a change of -19.89%
19/12/2023 FTSE Closed at 7638 points. Change of -100%. Total value traded through LSE was: £ 7,242,394,350 a change of 0%
18/12/2023 FTSE Closed at 7614 points. Change of 0%. Total value traded through LSE was: £ 4,288,360,200 a change of 0%
SUCCESS above means both FAST & SLOW targets were met. ‘CESS means just the FAST target met and probably the next time it is exceeded, movement to the SLOW target shall commence.
Our commentary is in two sections. Immediately below are today’s updated comments. If our commentary remains valid, the share can be found in the bottom section which has a RED heading. Hopefully, this will mean you no longer need to flip back through previous reports. HYPERLINKS DISABLED IN THIS VERSION
Please remember, all prices are mid-price (halfway between the Buy and Sell). When we refer to a price CLOSING above a specific level, we are viewing the point where we can regard a trend as changing. Otherwise, we are simply speculating on near term trading targets. Our website is www.trendsandtargets.com.
UPDATE. We often give an initial and a secondary price. If the initial is exceeded, we still expect it to fall back but the next time the initial is bettered, the price should continue to the secondary. The converse it true with price drops.
We can be contacted at info@trendsandtargets.com. Spam filters set to maximum so only legit emails get through…
Section One – Outlook Updated Today. Click here for Section Two – Outlook Remains Valid shares
Click Epic to jump to share: LSE:IGG IG Group** **LSE:PMG Parkmead** **LSE:SCLP Scancell** **LSE:SMT Scottish Mortgage Investment Trust** **LSE:SPT Spirent Comms** **LSE:SPX Spirax** **
********
Updated charts published on : IG Group, Parkmead, Scancell, Scottish Mortgage Investment Trust, Spirent Comms, Spirax,
LSE:IGG IG Group. Close Mid-Price: 764.5 Percentage Change: + 0.20% Day High: 768 Day Low: 757.5
In the event of IG Group enjoying further trades beyond 768, the share sh ……..
</p
View Previous IG Group & Big Picture ***
LSE:PMG Parkmead. Close Mid-Price: 20 Percentage Change: + 5.26% Day High: 21.25 Day Low: 19
Continued trades against PMG with a mid-price ABOVE 21.25 should improve ……..
</p
View Previous Parkmead & Big Picture ***
LSE:SCLP Scancell Close Mid-Price: 10.75 Percentage Change: -2.27% Day High: 11 Day Low: 10.38
If Scancell experiences continued weakness below 10.38, it will invariabl ……..
</p
View Previous Scancell & Big Picture ***
LSE:SMT Scottish Mortgage Investment Trust. Close Mid-Price: 808.4 Percentage Change: + 1.30% Day High: 810.2 Day Low: 799.4
Target met. All Scottish Mortgage Investment Trust needs are mid-price tr ……..
</p
View Previous Scottish Mortgage Investment Trust & Big Picture ***
LSE:SPT Spirent Comms Close Mid-Price: 122.4 Percentage Change: -0.57% Day High: 128.8 Day Low: 121.8
All Spirent Comms needs are mid-price trades ABOVE 128.8 to improve accel ……..
</p
View Previous Spirent Comms & Big Picture ***
LSE:SPX Spirax Close Mid-Price: 10510 Percentage Change: -0.24% Day High: 10630 Day Low: 10465
Continued trades against SPX with a mid-price ABOVE 10630 should improve ……..
</p
View Previous Spirax & Big Picture ***