#BrentFutures #WallSt There’s a golden rule about downtrends. Always draw the line through the high of the day. Equally, with uptrends, draw the line through the low of the day. All perfectly simple and unfortunately, sometimes utterly wrong. MGC currently exhibit a fascinating downtrend, one which makes very little sense as it fails to conform to ‘the rules’.
Since September, the share price has been declining in a steady, painful, manner with each day inflicting yet another little cut in the price. It can be difficult to believe this behaviour is due to conventional trading logic, especially as a glance at the price trend reveals something unusual. Reversals conform to a Closing Price trend, ignoring the highs and lows of the day. On the sessions of 15th and 18th October (circled), this behaviour was painfully obvious as the chart inset below shows. The share price, quite literally, run exactly at the level of the trend for those two sessions and out of curiosity, we backtracked the trend line to discover it commenced on February 18th, not at the high of the day (9.275p) but instead, at the day closing price of 7.43p.
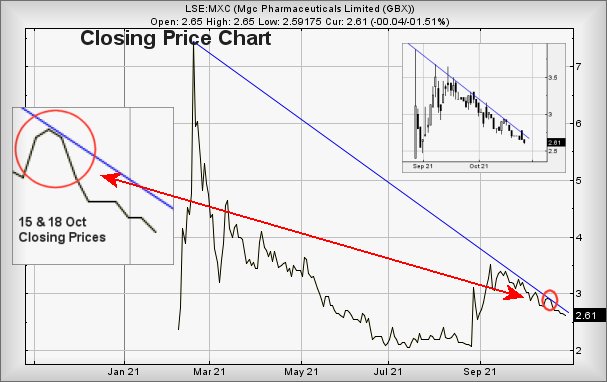
From our perspective, this both warns us to dampen expectations for the future but also, gives a pretty solid clue as to the point when the share price can be regarded as starting recovery. Should the market permit the share to actually close a session above this Blue line, some real hope becomes possible as the market indicates the downtrend is no longer valid. Hopefully!
For now, it appears weakness below 2.55 should head toward 2.3p next, ideally this proving to be a point capable of justifying a bounce. Our secondary, should the share manage to close below 2.3p is pretty concerning, an ultimate bottom of 1.3p.
Should the cannabis focussed company intend display some strength, above 2.95p should prove significant, calculating with the potential of recovery to an initial 4.1p. If exceeded, our longer term secondary works out at a less comfortable 5p
FUTURES
| Time Issued | Market | Price At Issue | Short Entry | Fast Exit | Slow Exit | Stop | Long Entry | Fast Exit | Slow Exit | Stop | Prior |
| 9:49:51PM | BRENT | 83.44 | 83.36 | 82.825 | 81.81 | 84.26 | 85.16 | 85.75 | 86.55 | 84.15 | Success |
| 9:51:53PM | GOLD | 1796.71 | |||||||||
| 9:53:26PM | FTSE | 7259.95 | |||||||||
| 9:55:58PM | FRANCE | 6734.5 | Shambles | ||||||||
| 9:57:45PM | GERMANY | 15683.3 | |||||||||
| 10:00:08PM | US500 | 4555.87 | ‘cess | ||||||||
| 10:02:27PM | DOW | 35537.2 | 35495 | 35401 | 35235 | 35605 | 35705 | 35744 | 35827 | 35610 | Success |
| 10:04:22PM | NASDAQ | 15609.69 | |||||||||
| 10:06:40PM | JAPAN | 28683 | Success |
Again, our thanks to the kind folk who find advertising on this page worth a visit. We seriously appreciate our daily coffee!
.
27/10/2021 FTSE Closed at 7253 points. Change of -0.33%. Total value traded through LSE was: £ 5,032,708,114 a change of -16.48%
26/10/2021 FTSE Closed at 7277 points. Change of 0.76%. Total value traded through LSE was: £ 6,025,954,185 a change of 32.49%
25/10/2021 FTSE Closed at 7222 points. Change of 0.25%. Total value traded through LSE was: £ 4,548,373,792 a change of -2.6%
22/10/2021 FTSE Closed at 7204 points. Change of 0.19%. Total value traded through LSE was: £ 4,669,794,204 a change of -12.27%
21/10/2021 FTSE Closed at 7190 points. Change of -0.46%. Total value traded through LSE was: £ 5,323,076,986 a change of 2.72%
20/10/2021 FTSE Closed at 7223 points. Change of 0.08%. Total value traded through LSE was: £ 5,182,365,180 a change of -1.88%
19/10/2021 FTSE Closed at 7217 points. Change of 0.19%. Total value traded through LSE was: £ 5,281,678,962 a change of 1.68%
SUCCESS above means both FAST & SLOW targets were met. ‘CESS means just the FAST target met and probably the next time it is exceeded, movement to the SLOW target shall commence.
Our commentary is in two sections. Immediately below are today’s updated comments. If our commentary remains valid, the share can be found in the bottom section which has a RED heading. Hopefully, this will mean you no longer need to flip back through previous reports. HYPERLINKS DISABLED IN THIS VERSION
Please remember, all prices are mid-price (halfway between the Buy and Sell). When we refer to a price CLOSING above a specific level, we are viewing the point where we can regard a trend as changing. Otherwise, we are simply speculating on near term trading targets. Our website is www.trendsandtargets.com.
UPDATE. We often give an initial and a secondary price. If the initial is exceeded, we still expect it to fall back but the next time the initial is bettered, the price should continue to the secondary. The converse it true with price drops.
We can be contacted at info@trendsandtargets.com. Spam filters set to maximum so only legit emails get through…
Section One – Outlook Updated Today. Click here for Section Two – Outlook Remains Valid shares
Click Epic to jump to share: LSE:BLOE Block Energy PLC** **LSE:CAR Carclo** **LSE:CPI Capita** **LSE:FGP Firstgroup** **LSE:HSBA HSBC** **LSE:IPF International Personal Finance** **LSE:NWG Natwest** **LSE:PPC President Energy** **LSE:SBRY Sainsbury** **LSE:TLW Tullow** **
********
Updated charts published on : Block Energy PLC, Carclo, Capita, Firstgroup, HSBC, International Personal Finance, Natwest, President Energy, Sainsbury, Tullow,
LSE:BLOE Block Energy PLC Close Mid-Price: 1.55 Percentage Change: -1.59% Day High: 1.55 Day Low: 1.43
If Block Energy PLC experiences continued weakness below 1.43, it will in ……..
</p
View Previous Block Energy PLC & Big Picture ***
LSE:CAR Carclo. Close Mid-Price: 42.2 Percentage Change: + 2.06% Day High: 43.9 Day Low: 41.5
In the event of Carclo enjoying further trades beyond 43.9, the share sho ……..
</p
View Previous Carclo & Big Picture ***
LSE:CPI Capita. Close Mid-Price: 48.4 Percentage Change: + 1.06% Day High: 48.69 Day Low: 47.52
Now above 54p allows movement to 60 initially. If bettered, our secondary ……..
</p
View Previous Capita & Big Picture ***
LSE:FGP Firstgroup. Close Mid-Price: 100.5 Percentage Change: + 4.52% Day High: 102.7 Day Low: 99
Target met. All Firstgroup needs are mid-price trades ABOVE 102.7 to impr ……..
</p
View Previous Firstgroup & Big Picture ***
LSE:HSBA HSBC Close Mid-Price: 444.7 Percentage Change: -0.55% Day High: 448.15 Day Low: 442.5
Exceeding 449 now looks capable of an initial 467 with secondary, if bette ……..
</p
View Previous HSBC & Big Picture ***
LSE:IPF International Personal Finance. Close Mid-Price: 134 Percentage Change: + 2.13% Day High: 135.2 Day Low: 128.4
Below 126 now looks troublesome, suggesting weakness to an initial 115 wit ……..
</p
View Previous International Personal Finance & Big Picture ***
LSE:NWG Natwest Close Mid-Price: 233 Percentage Change: -0.55% Day High: 235 Day Low: 232.4
All Natwest needs are mid-price trades ABOVE 235 to improve acceleration ……..
</p
View Previous Natwest & Big Picture ***
LSE:PPC President Energy. Close Mid-Price: 1.95 Percentage Change: + 0.00% Day High: 1.95 Day Low: 1.95
Now mildly interesting as ^above 1.95 now suggests recovery to an initial ……..
</p
View Previous President Energy & Big Picture ***
LSE:SBRY Sainsbury. Close Mid-Price: 306.5 Percentage Change: + 1.69% Day High: 306.6 Day Low: 300.6
Continued trades against SBRY with a mid-price ABOVE 306.6 should improve ……..
</p
View Previous Sainsbury & Big Picture ***
LSE:TLW Tullow Close Mid-Price: 48.01 Percentage Change: -0.39% Day High: 48.53 Day Low: 46.73
If Tullow experiences continued weakness below 46.73, it will invariably ……..
</p
View Previous Tullow & Big Picture ***