#FTSE #Gold To suggest Thursday was a disappointment would be an understatement. We often moan about the Bank of England doing their utmost to dampen business and consumer confidence in the UK, keeping the country trapped under what feels like a never ending grey sky. In the USA, Mr Trump has railed against the US Federal Reserve for their timidity in reducing Interest Rates but in the UK, we seem to lack leadership which actually cares about injecting any optimism to the national mood, happy to ignore the damage high interest rates inflict.
It proved quite irksome, giving our World Market Futures projections, once the BoE had slithered again under its own rock, the FTSE standing out against the others with a weak outlook. We’re again forced to wait a further 6 weeks before the UK Central bank again has an opportunity to allow some business confidence, along with reducing inflationary pressure on prices. Hopefully, the start of November shall bring some sanity to the Monetary Policy Committee, along with a broader realisation their fight against inflation by raising prices doesn’t actually work.
To be fair, this is a personal hobbyhorse, right up there with irritation at the UK Governments Tax on Employment, called the Employers National Insurance Contribution. The most recent increase of the tax on jobs, unsurprisingly is attributed with causing “blips” in UK jobless numbers, politicians shy of discussing such data and “journalists” avoiding any subject which might embarrass the current government. Quite why the powers-that-be failed to understand the only way to improve is to actually Make Money, rather than Take Money, probably reflects the vast majority of politicians boasting a background as Local Councillors, where they perceived their only major source of income was coming from Rates, both business and domestic.
We suspect events in London last weekend, where the BBC initially reported several hundred <sic> Far Right fanatics were protesting, were a symptom of this frustration at our central government who don’t seem to know how to actually run a country.
But on the bright side, we’ve a new animal in our garden and we’ve absolutely no idea what it is. Russell and Cheryl, our two crows, were ripping apart a couple of bread rolls on the lawn when we noticed something Ginger coloured, porpoising through the long grass around them. It was about the size of a squirrel but lacked the bushy tail and the crows were keeping a close eye on it, while moving their haul of bread closer to themselves. We decided it wasn’t a Pine Marten as it was too small, didn’t move like any rat – and lacked a tail. But the crows were wary of it, neither choosing to attack. We wonder if it was a young otter, perfectly capable of leaving the sea and coming up the garden stream, but despite being in Scotland, Ginger isn’t usually part of the approved colour scheme for otters. Hopefully Friday shall provide a dry spell, where either a camera shall be used or, if its a rat, a rifle, when some more bread rolls are laid out.
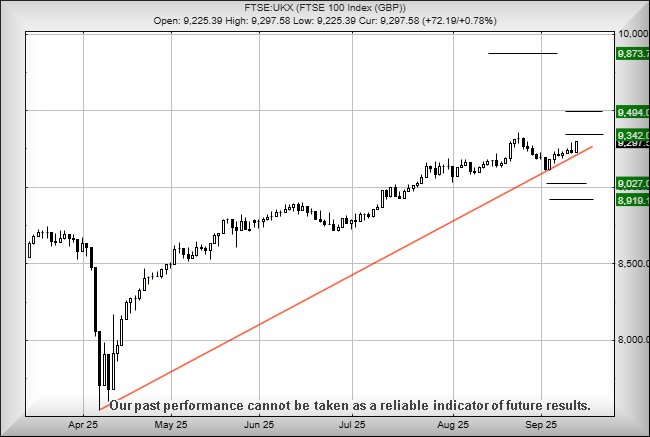
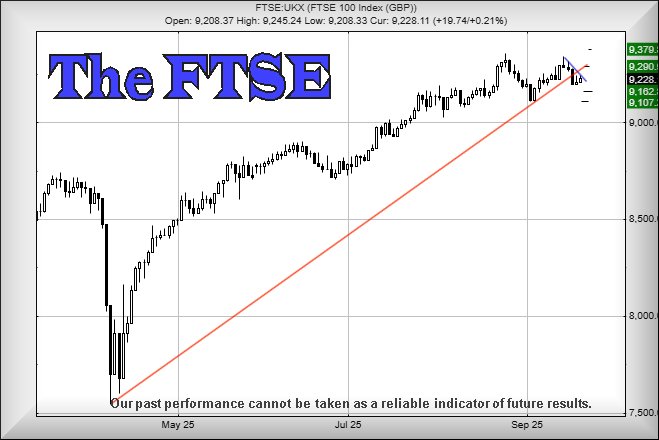
As for the FTSE for the immediate future, we’re about as perplexed as we were with the strange animal in the garden. The UK index has experienced a neatly choreographed drop this week, one which looks like it shall have trouble escaping the BoE’s effect. Instead, weakness next below 9203 points has the potential of provoking a visit to 9162 points and a very possible bounce. But should 9162 points break, the UK index could easily falter down to an eventual 9107 points and a return to the lows seen at the start of September this year. If this scenario triggers, a reasonable Stop Loss looks like 9245 points.
Of course, there’s always the awful risk of going into a weekend with an open position, one which might bite due to whatever world event occurs.
If the FTSE is to make any real attempt to redeem itself, above 9263 could allegedly trigger recovery to an initial 9290 points with our secondary, if exceeded, calculating as an extremely unlikely 9379 points.
Have a good weekend. Hopefully the Grand Prix from Azerbaijan gives an interesting qualifying session. Unfortunately, the race can sometimes be quite processional, though nothing like the abhorrent Monaco money pit.
FUTURES
FUTURES
| Time Issued | Market | Price At Issue | Short Entry | Fast Exit | Slow Exit | Stop | Long Entry | Fast Exit | Slow Exit | Stop | Prior |
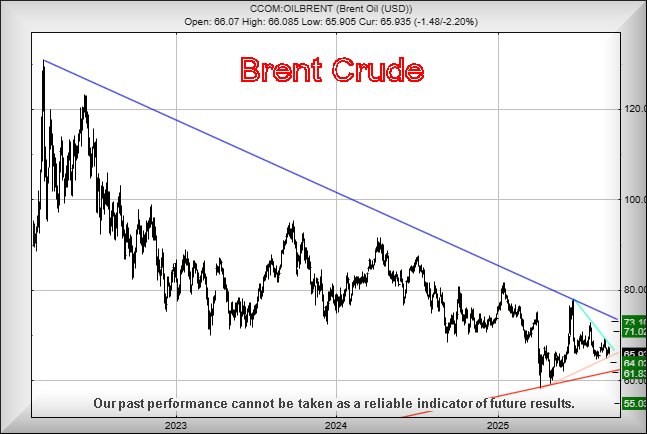
| 10:38:34PM | BRENT | 6719.8 | 6690 | 6662 | 6737 | 6745 | 6818 | 6711 | |||
| 10:43:58PM | GOLD | 3641.74 | 3627 | 3619 | 3647 | 3646 | 3649 | 3643 | ‘cess | ||
| 10:46:44PM | FTSE | 9241.1 | 9207 | 9200 | 9230 | 9242 | 9249 | 9228 | |||
| 10:52:57PM | STOX50 | 5463.2 | 5430 | 5415 | 5446 | 5466 | 5471 | 5441 | Success | ||
| 10:55:41PM | GERMANY | 23724.3 | 23568 | 23507 | 23642 | 23726 | 23891 | 23644 | Success | ||
| 10:58:10PM | US500 | 6645.2 | 6610 | 6602 | 6640 | 6658 | 6670 | 6638 | Success | ||
| 11:03:42PM | DOW | 46246.5 | 45944 | 45813 | 46172 | 46288 | 46473 | 46130 | ‘cess | ||
| 11:16:36PM | NASDAQ | 24490 | 24310 | 24239 | 24420 | 24560 | 24623 | 24467 | Success | ||
| 11:20:46PM | JAPAN | 45866 | 45283 | 45023 | 45550 | 45935 | 46081 | 45630 |
18/09/2025 FTSE Closed at 9228 points. Change of 0.22%. Total value traded through LSE was: £ 5,470,749,356 a change of 5.44%
17/09/2025 FTSE Closed at 9208 points. Change of 0.14%. Total value traded through LSE was: £ 5,188,517,809 a change of -11.11%
16/09/2025 FTSE Closed at 9195 points. Change of -0.88%. Total value traded through LSE was: £ 5,836,701,503 a change of 13.9%
15/09/2025 FTSE Closed at 9277 points. Change of -0.06%. Total value traded through LSE was: £ 5,124,504,308 a change of 3.82%
12/09/2025 FTSE Closed at 9283 points. Change of -0.15%. Total value traded through LSE was: £ 4,936,038,879 a change of -3.79%
11/09/2025 FTSE Closed at 9297 points. Change of 0.78%. Total value traded through LSE was: £ 5,130,576,096 a change of -11.59%
10/09/2025 FTSE Closed at 9225 points. Change of -0.18%. Total value traded through LSE was: £ 5,802,988,432 a change of 11.05% 
SUCCESS above means both FAST & SLOW targets were met. ‘CESS means just the FAST target met and probably the next time it is exceeded, movement to the SLOW target shall commence.
Our commentary is in two sections. Immediately below are today’s updated comments. If our commentary remains valid, the share can be found in the bottom section which has a RED heading. Hopefully, this will mean you no longer need to flip back through previous reports. HYPERLINKS DISABLED IN THIS VERSION
Please remember, all prices are mid-price (halfway between the Buy and Sell). When we refer to a price CLOSING above a specific level, we are viewing the point where we can regard a trend as changing. Otherwise, we are simply speculating on near term trading targets. Our website is www.trendsandtargets.com.
UPDATE. We often give an initial and a secondary price. If the initial is exceeded, we still expect it to fall back but the next time the initial is bettered, the price should continue to the secondary. The converse it true with price drops.
We can be contacted at info@trendsandtargets.com. Spam filters set to maximum so only legit emails get through…
Section One – Outlook Updated Today. Click here for Section Two – Outlook Remains Valid shares
Click Epic to jump to share: LSE:BBY BALFOUR BEATTY** **LSE:ECO ECO (Atlantic) O & G** **LSE:HSBA HSBC** **LSE:SMT Scottish Mortgage Investment Trust** **
********
Updated charts published on : BALFOUR BEATTY, ECO (Atlantic) O & G, HSBC, Scottish Mortgage Investment Trust,
LSE:BBY BALFOUR BEATTY. Close Mid-Price: 637.5 Percentage Change: + 1.43% Day High: 641.5 Day Low: 629
All BALFOUR BEATTY needs are mid-price trades ABOVE 641.5 to improve acce ……..
</p
View Previous BALFOUR BEATTY & Big Picture ***
LSE:ECO ECO (Atlantic) O & G Close Mid-Price: 7.3 Percentage Change: -2.67% Day High: 7.5 Day Low: 7.25
In the event ECO (Atlantic) O & G experiences weakness below 7.25 it calc ……..
</p
View Previous ECO (Atlantic) O & G & Big Picture ***
LSE:HSBA HSBC. Close Mid-Price: 1018.8 Percentage Change: + 0.39% Day High: 1023.2 Day Low: 1011
Further movement against HSBC ABOVE 1023.2 should improve acceleration to ……..
</p
View Previous HSBC & Big Picture ***
LSE:SMT Scottish Mortgage Investment Trust. Close Mid-Price: 1141 Percentage Change: + 2.65% Day High: 1140.5 Day Low: 1120
Target met. Further movement against Scottish Mortgage Investment Trust A ……..
</p
View Previous Scottish Mortgage Investment Trust & Big Picture ***