
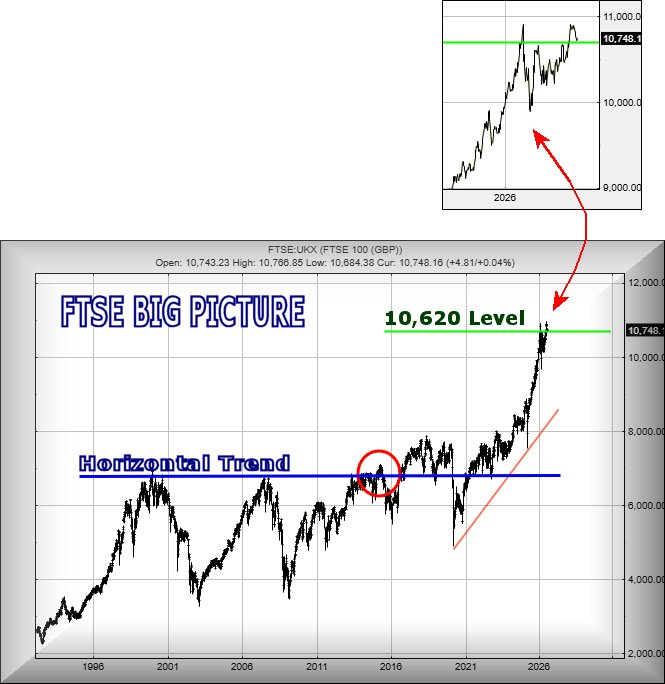
We often remind how important it is to zoom and review things from a Big Picture perspective. And the FTSE is now displaying one of our favourite “charty” examples, the market creating a very visible horizontal trend since 1999. What’s quite interesting from the FTSE example occurred in 2015 (circled), the market proving the horizontal trend could be exceeded, giving (from our perspective) a pretty reliable signal things could become useful. By June of 2015, it almost felt like the index had realised what was about to happen, introducing panic reversal which didn’t last. In early 2016, the market once again exceeded the Blue horizontal trend, achieving a higher high.
For a few years, things looked quite jolly until 2020 collided with the world, the artificial market drops introduced by Covid-19 and the incompetence of politicians everywhere. By 2022, once again the FTSE was enjoying Higher Highs and this time, the index has simply kept going.
What has surprised us – quite a lot – comes from our core Big Picture logic, a series of arguments which present 10,620 as a “maximum top”, the price level beyond which we are not supposed to be able to calculate. As the zoomed in chart extract highlights, our theoretical 10,620 looks like the calculation was probably correct, the index value spending this year bouncing around at the target level, even managing to close above it a few times. This looks significant, indicating the index is liable to continue heading upward at some point.
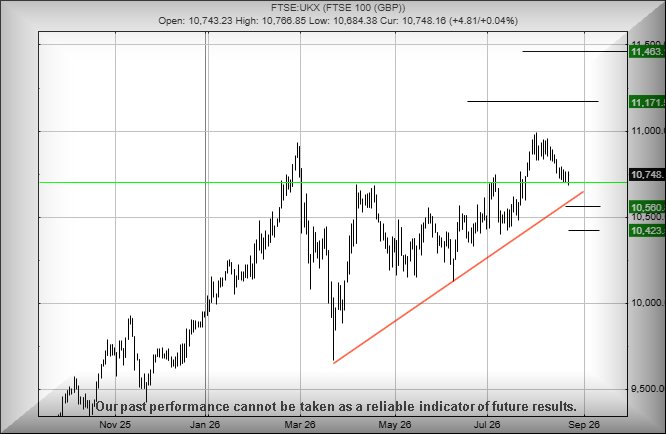
This is one of these things you may wish to print out an save. Should the FTSE continue adhering to our dodgy arithmetic rules established since 2015, it is now the case where movement above 10,904 points should trigger further growth to 11,171 points with our secondary, if beaten, at another “top” which now works out at 11,463 points. If this scenario triggers, the tightest stop loss level calculates at 10,800 points.
Of course, we can throw in an alternate scenario if any attempt is made to slow down the growth cycle. As a result, if the index drops below 10,670 points, it risks triggering reversal down to an initial 10,560 points with our secondary, if broken, at 10,423 points and visually, a strong potential for a bounce. Perhaps this may play out during the next couple of weeks until the grown ups return from holiday by the 2nd week of September, when things tend pick up again.
Have a good weekend. It’s the Belgian GP which can be quite fun, especially if it rains. Here in Argyll, apparently we face drought conditions as there’s a risk no rain will fall during the next 3 days…
FUTURES
FUTURES
| Time Issued | Market | Price At Issue | Short Entry | Fast Exit | Slow Exit | Stop | Long Entry | Fast Exit | Slow Exit | Stop | Prior |
| 10:33:12PM | BRENT | 9136.2 | 8899 | 8768 | 9101 | 9302 | 9602 | 9136 | Success | ||
| 10:50:31PM | GOLD | 4518.01 | 4452 | 4431 | 4492 | 4540 | 4558 | 4503 | ‘cess | ||
| 11:35:19PM | FTSE | 10736.3 | 10682 | 10669 | 10724 | 10768 | 10781 | 10730 | Success | ||
| 11:40:12PM | STOX50 | 6420.4 | 6405 | 6394 | 6448 | 6492 | 6520 | 6534 | ‘cess | ||
| 10:58:14PM | GERMANY | 25976 | 25914 | 25887 | 26020 | 26136 | 26211 | 26057 | |||
| 11:03:52PM | US500 | 7651.1 | 7640 | 7617 | 7655 | 7700 | 7716 | 7670 | ‘cess | ||
| 11:09:10PM | DOW | 52794.2 | 52733 | 52095 | 53071 | 53223 | 53354 | 53000 | ‘cess | ||
| 11:33:35PM | NASDAQ | 29234.7 | 29118 | 29098 | 29294 | 29497 | 29655 | 29395 | ‘cess |

SUCCESS above means both FAST & SLOW targets were met. ‘CESS means just the FAST target met and probably the next time it is exceeded, movement to the SLOW target shall commence.
Our commentary is in two sections. Immediately below are today’s updated comments. If our commentary remains valid, the share can be found in the bottom section which has a RED heading. Hopefully, this will mean you no longer need to flip back through previous reports. HYPERLINKS DISABLED IN THIS VERSION
Please remember, all prices are mid-price (halfway between the Buy and Sell). When we refer to a price CLOSING above a specific level, we are viewing the point where we can regard a trend as changing. Otherwise, we are simply speculating on near term trading targets. Our website is www.trendsandtargets.com.
UPDATE. We often give an initial and a secondary price. If the initial is exceeded, we still expect it to fall back but the next time the initial is bettered, the price should continue to the secondary. The converse it true with price drops.
We can be contacted at info@trendsandtargets.com. Spam filters set to maximum so only legit emails get through…
Section One – Outlook Updated Today. Click here for Section Two – Outlook Remains Valid shares
Click Epic to jump to share: LSE:GLEN Glencore Xstra** **LSE:ONT Oxford Nanopore Tech** **LSE:PMG Parkmead** **LSE:TLW Tullow** **LSE:TRN The Trainline** **
********
Updated charts published on : Oxford Nanopore Tech, Parkmead, Tullow, The Trainline,
LSE:GLEN Glencore Xstra. Close Mid-Price: 584.5 Percentage Change: + 0.00% Day High: 584.5 Day Low: 569.2
If the price of Glencore Xstra manages to move ABOVE 584.5, initial UP ta ……..
</p
View Previous Glencore Xstra & Big Picture ***
LSE:ONT Oxford Nanopore Tech. Close Mid-Price: 164.5 Percentage Change: + 0.00% Day High: 164.5 Day Low: 141.9
Target met. In the event of Oxford Nanopore Tech enjoying further trades ……..
</p
View Previous Oxford Nanopore Tech & Big Picture ***
LSE:PMG Parkmead. Close Mid-Price: 22.5 Percentage Change: + 0.00% Day High: 23.1 Day Low: 21
In the event of PMG share price managing to exceed 23.1 (please, not an i ……..
</p
View Previous Parkmead & Big Picture ***
LSE:TLW Tullow. Close Mid-Price: 19.9 Percentage Change: + 0.00% Day High: 20.1 Day Low: 17.98
Target met. Simply managing to get the share price above 20.1 is the next ……..
</p
View Previous Tullow & Big Picture ***
LSE:TRN The Trainline. Close Mid-Price: 190 Percentage Change: + 0.00% Day High: 208.6 Day Low: 181
Target met. Continued weakness against TRN taking the price below 181 cal ……..
</p
View Previous The Trainline & Big Picture ***
*** End of “Updated Today” comments on shares. Listed below are those where commentary remains valid.
Click Epic to jump to share:LSE:AAL Anglo American** **LSE:AML Aston Martin** **LSE:ASC Asos** **LSE:AV. Aviva** **LSE:AVCT Avacta** **LSE:AZN Astrazeneca** **LSE:BARC Barclays** **LSE:BBY BALFOUR BEATTY** **LSE:BLOE Block Energy PLC** **LSE:BME B & M** **LSE:BP. BP PLC** **LSE:BT.A British Telecom** **LSE:CAR Carclo** **LSE:CNA Centrica** **LSE:CPI Capita** **LSE:DGE Diageo** **LSE:ECO ECO (Atlantic) O & G** **LSE:EMG MAN** **LSE:EXPN Experian** **LSE:EZJ EasyJet** **LSE:FGP Firstgroup** **LSE:FOXT Foxtons** **LSE:FRES Fresnillo** **LSE:GENL Genel** **LSE:GKP Gulf Keystone** **LSE:GRG Greggs** **LSE:HIK Hikma** **LSE:HSBA HSBC** **LSE:IAG British Airways** **LSE:IGG IG Group** **LSE:IQE IQE** **LSE:ITM ITM Power** **LSE:ITRK Intertek** **LSE:ITV ITV** **LSE:LLOY Lloyds Grp.** **LSE:MKS Marks and Spencer** **LSE:MRO Melrose** **LSE:NG. National Glib** **LSE:NWG Natwest** **LSE:OCDO Ocado Plc** **LSE:OXIG Oxford Instruments** **LSE:PHP Primary Health** **LSE:QED Quadrise** **LSE:RKH Rockhopper** **LSE:RR. Rolls Royce** **LSE:SAGA SAGA Plc** **LSE:SBRY Sainsbury** **LSE:SCLP Scancell** **LSE:SDY Speedyhire** **LSE:SFOR S4 Capital** **LSE:SMT Scottish Mortgage Investment Trust** **LSE:SPX Spirax** **LSE:SRP Serco** **LSE:STAN Standard Chartered** **LSE:STAR Star Energy** **LSE:TERN Tern Plc** **LSE:TSCO Tesco** **LSE:TW. Taylor Wimpey** **LSE:VOD Vodafone** **LSE:ZOO Zoo Digital** **