

Tweet
________________________________________________________________________________________________
If the trade works for you and you want more information, feel free to subscribe as we like talking to customers...
13.06.2016 and maybe Lloyds too...
To no-ones surprise, the markets are a bit confundled in the run up to the EuroShambles. Those folk watching the FTSE will be perfectly aware each time it 'should' have bottomed, the market has had other ideas, primarily due to the Big Picture attraction from 5750.
At time of writing on Monday 13th, we had a drop potential on the FTSE at 6049 and the lowest the market has achieved today has been 6051.
Does this additional 2 points mean the markets have hidden strengths? We doubt it as too many shares broke below some pretty major near term targets last week, meaning we should look for weakness as LONG positions are liable to underperform.
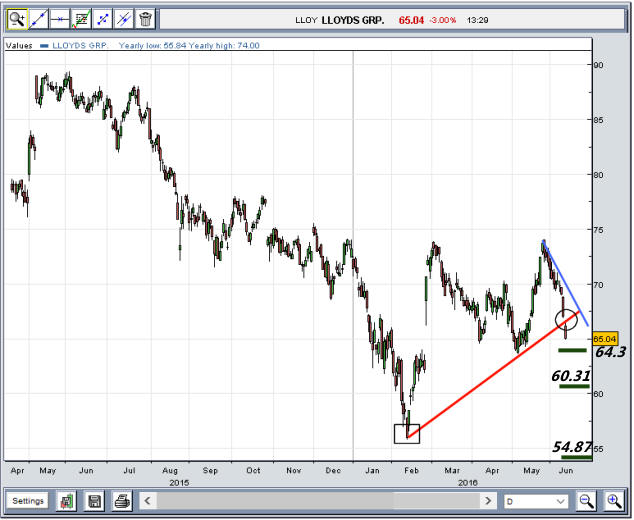
In the case of Lloyds, the current price cycle shows a drop target below 64.9 as 64.3 next. The share price needs better 69.5 just to escape its immediate doom. Our secondary WHEN 64.3 breaks calculates at 60.31 and the ruling attraction for the longer term is seen as a "Must Bounce" 54.87p.
Too many numbers?
Hopefully a glance at the chart makes some sense;
1. Circled, evidence the market is forcing Lloyds price down
2. The BLUE line delineates the immediate DROP force
3. The RED line delineates the prior UPTREND
4. The BOX shows a hidden gap in price movements - from 56p
What all this means - to us - is the range of downward forces are quite impressive and we'd be daft suggesting any LONG positions. Unless the share price betters that BLUE line - currently 69.5p
Long story short, the chart suggests SHORT Lloyds and place a stop above 69.5p, then let the politicians continue to do their thing.
Click here for our
special subscription offer.
N