FTSE for 9/08/2019

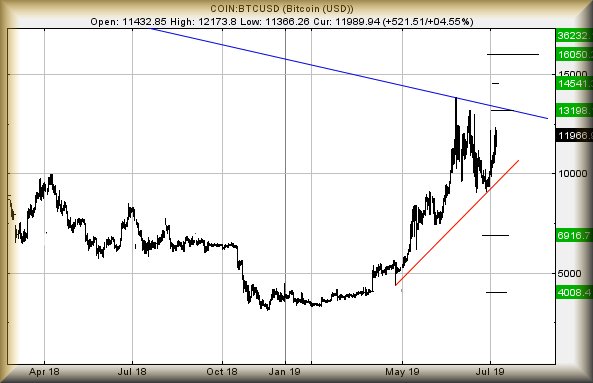
#DOW #DAX #GOLD Unusually, this is a report I’d prefer not write! Why? Because the market is making little sense presently. August is supposed to be a bit boring but predictable except thanks to a toxic combination of Mr Trump & Boris, it seems the world doesn’t know how to react.

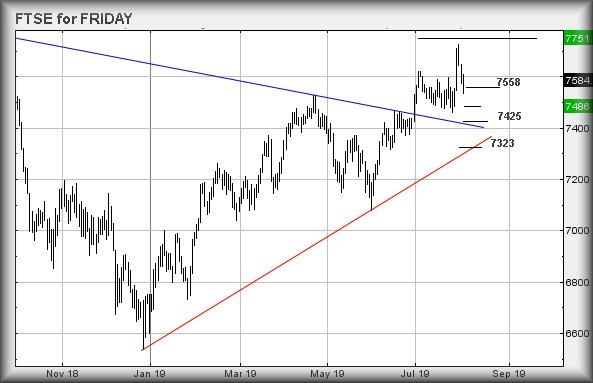
There’s often a reversal in the markets at the end of July / start of August and we often feel it’s the case of the markets being “parked” during the holiday season. This allows a bit of volatility but strong movements are never expected until the grown-ups return in September. This year has been just a little different and the FTSE, for instance, has been abandoned in a region where The Big Picture promises reversal down to 6,600 or so.

If the market has indeed been “parked”, it’s the equivalent of dumping your kids in the central divider of the M25 and telling them to place on the grass while you go shopping. As the chart below highlights, the market is now trading below this years uptrend, only needing some negative force to drive a dangerous and sharp reversal.

Taking the attitude of the market indeed being parked, it appears anything near term on the FTSE above 7,286 points should prove capable of a lift to an initial 7,332 points. If exceeded (and we do not expect all this on a Friday!) our secondary calculation is at 7,408 points. As the chart illustrates, the primary target indicates a challenge return to the RED uptrend. If the secondary is achieved, it will appear the drop was indeed inspired by the holiday mood and we should hope for further recovery as the month continues.

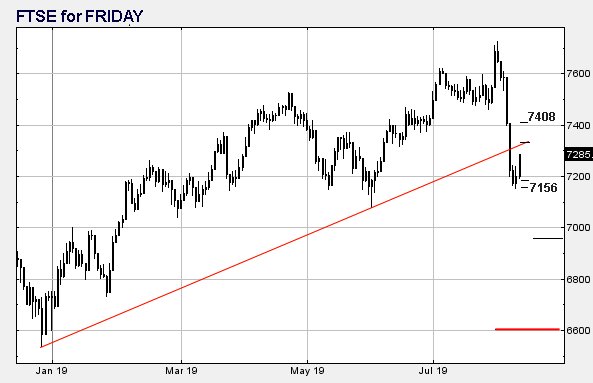
Of course, we’d be remiss if we didn’t peer into the abyss…

It looks like the index now requires fail below 7,207 points to cause anguish as this calculates with an initial potential of 7,185 points. If broken, secondary is at 7,156 points. Visually, there is reason to hope for a bounce, should 7,156 make an appearance.

FUTURES

Time Issued

Market

Price At Issue

Short Entry

Fast Exit

Slow Exit

Stop

Long Entry

Fast Exit

Slow Exit

Stop

Prior

10:04:57PM

BRENT

57.63

56.64

56.235


57.62

57.92

58.545


56.96

10:22:29PM

GOLD

1501.49

1489

1481.5


1510

1510

1516


1492

10:24:19PM

FTSE

7276.74

7214

7197.5


7304

7305

7328


7233

‘cess

10:26:12PM

FRANCE

5371

5331

5313


5376

5388

5404


5338

Success

10:28:02PM

GERMANY

11807.16

11716

11672


11813

11855

11890


11733

10:29:52PM

US500

2932.07

2880

2868.5


2907

2942

2950


2893

Success

10:32:59PM

DOW

26353.5

26102

26005


26209

26400

26434


26240

‘cess

10:35:41PM

NASDAQ

7710

7551

7493.5


7607

7741

7799.5


7574

Success

10:37:28PM

JAPAN

20790

20520

20456.5


20679

20815

20937


20520


8/08/2019 FTSE Closed at 7286 points. Change of 1.22%. Total value traded through LSE was: £ 7,419,094,252 a change of 8.46%

Bitcoin for 8/08/2019

#SP500 #DOW We noticed Bitcoin has been doing “Bitcoin Stuff” this week, exhibiting wild and irrational movements. Like a moth to a flame, we’ve again attempted make some sense as our last report at the start of July (Link Here) proved quite prescient.

At time of writing, it’s trading around the 12,000 mark and the immediate situation suggests anything now exceeding 12,615 threatens some growth to an initial 13,198 dollars. A movement such as this hints at a challenge of the ruling BLUE downtrend, probably quite soon. Exceeding 13,198 is liable to prove interesting as we’re not the only folk equiped with a crayon to draw trend lines. Essentially, the market will doubtless assume Bitcoin is once again heading upward and our secondary of 14,540 looks quite attainable.

To be completely factual, should Bitcoin opt to do “Bitcoin Stuff” and completely outperform logic, it could easily accelerate toward the 16,000 level, perhaps even 16,600. Once in the 16,000’s, we have a flashing red light which anticipates volatility should such a level actually appear. Needless to say, it will also be true to suggest media pundits will start projecting Bitcoin heading to 20,000 dollars and above, depending on which number they pluck out of the ether.

We will grudgingly admit to some calculation issues, if this imaginary currency manages above 16,600 as the price should (logically) almost double.

Alternately, below RED and it faces a slowdown to 6,900 initially. Secondary is at the 4,000 level!

FUTURES

Time Issued

Market

Price At Issue

Short Entry

Fast Exit

Slow Exit

Stop

Long Entry

Fast Exit

Slow Exit

Stop

Prior

10:13:28PM

BRENT

57.34


Success

10:15:32PM

GOLD

1501.79


Success

10:17:44PM

FTSE

7207.9


10:19:07PM

FRANCE

5302.7


Shambles

10:26:27PM

GERMANY

11712.83


10:28:48PM

US500

2881.32

2824

2819.5

2795

2885

2892

2900

2924

2846

Shambles

10:32:05PM

DOW

25956

25644

25590

25423

25807

26091

26121

26475

25800

Shambles

10:43:08PM

NASDAQ

7547


10:47:46PM

JAPAN

20613


‘cess

7/08/2019 FTSE Closed at 7198 points. Change of 0.38%. Total value traded through LSE was: £ 6,840,689,185 a change of 2.45%

Thomas Cook for 7/08/2019

#CAC40 #SP500 Sometimes, passengers in an aircraft experience an awful moment on the ground, waiting to disembark. An announcement says there will be a delay “of just a few minutes” and seasoned travellers know what that really means. Today, Tuesday, passengers in TCG’s share price disaster (prior successful report link) must have felt a similar emotion, the price looking like it was about to recover, then a “gotcha suckers” drop!

Over the years, we’ve warned repeatedly about the dangers of opening second spikes in a share. These price movements can run in either direction but our rule of thumb is of a spike down signalling a coming upward movement. Obviously, the converse is true for a spike up. TCG was spiked to 15p, curiously NOT in the opening second but rather, twelve minutes after the market opened. While perhaps this indicates a change in market strategy (as we’ve seen this a few times in the last month) but regardless, the effect was pretty dire and allows Thomas Cook to experience a trading range of 65.08%  for Tuesday. It was virtually impossible to allocate a sensible stop loss, regardless of which direction you thought it was going and perhaps this was the markets idea.

We’ve a bit of in-house mumbo jumbo now warning of danger, if Thomas Cook somehow makes it below 7.65p. Apparently, this will be a bad thing and calculates with the potential of travel down to an initial 5.3p. If broken, secondary is at 2p and hopefully bottom. Ultimate bottom is MINUS 18p (not possible).

However, for now I suspect holders of TCG are simply stuck on board, awaiting something positive happening. Price movements on the 6th August did suggest a holding pattern was being employed. If this is indeed the case, anything now exceeding 13.6p is liable to prove useful, bettering the BLUE downtrend and calculating with the potential of 19p next. If bettered, our secondary is at 23.3p and an almost certain hesitation in the recovery cycle.

FUTURES

Time Issued

Market

Price At Issue

Short Entry

Fast Exit

Slow Exit

Stop

Long Entry

Fast Exit

Slow Exit

Stop

Prior

9:57:00PM

BRENT

58.49


‘cess

10:10:16PM

GOLD

1475.06


10:12:41PM

FTSE

7206.66


10:14:53PM

FRANCE

5267.7

5228

5208.5

5179

5287

5298

5319.5

5364

5243

Success

10:28:35PM

GERMANY

11629


10:31:09PM

US500

2877.27

2830

2808

2782

2861

2889

2901

2925

2830

‘cess

10:33:35PM

DOW

25966


Success

10:35:44PM

NASDAQ

7514.12


‘cess

10:37:35PM

JAPAN

20635


Success


6/08/2019 FTSE Closed at 7171 points. Change of -0.72%. Total value traded through LSE was: £ 6,677,276,467 a change of 2.51%

GBPEUR for 6/08/2019

#Gold #Nasdaq Forex can be a blooming nuisance. When GBPEUR managed to hit our 1.085, normally we’d hope for a rebound of some substance. Unfortunately, the relationship faltered slightly below target, forcing us to actually work at projecting the next phase. Assuming the politicians involved achieve their usual standard of competence, the future looks pretty vile. But really cheap for tourists coming from Europe!

We’re no longer entirely confident this pairing shall bounce convincingly, thanks to our target level breaking. Instead, weakness now below 1.083 looks like entering a fresh cycle down to an initial 1.0700. If broken, secondary calculates at 1.0337. Allegedly, the relation almost must experience some recovery at such a level, if only to generate sufficient weight for longer term drops! Make no mistake, by any standards GBPEUR is officially horrible as the longer term calculation claims a gravitational attraction is being exerted from a distant looking 0.84.

To get out of this mess, Sterling needs recover above BLUE on the chart, presently at 1.145. A miracle such as this calculates with 1.588 as an initial ambition with secondary, if bettered, up at 1.200.

In summary, it starts to appear UK Goods shall be extremely attractive as exports to Europe in the event of Brexit. Of course, whether anyone will be able to export from the start of November is the big question, if a trade arrangement  remains absent. Perhaps we shall witness the situation with small boats crossing the channel from Europe, loaded with illegal migrants then returning to France loaded with illegal Scotch & Gin!

FUTURES

Time Issued

Market

Price At Issue

Short Entry

Fast Exit

Slow Exit

Stop

Long Entry

Fast Exit

Slow Exit

Stop

Prior

10:07:23PM

BRENT

60.09


Success

10:11:02PM

GOLD

1464.7

1450

1444.5

1436

1462

1470

1479

1492

1454

Success

10:15:48PM

FTSE

7161.82


Success

10:24:28PM

FRANCE

5221.2


Success

10:28:05PM

GERMANY

11552.45


Success

10:36:24PM

US500

2826.02


Success

10:45:14PM

DOW

25566


Success

10:48:00PM

NASDAQ

7367.12

7351

7245

7131

7453

7477

7517

7553

7409

Success

10:50:05PM

JAPAN

20200


Success

5/08/2019 FTSE Closed at 7223 points. Change of -2.48%. Total value traded through LSE was: £ 6,514,005,349 a change of -7.03%

RBS for 5/08/2019

#DAX #BRENT Our previous report on RBS (link here) strongly suspected the price would reverse to 202p. It did, closing Friday at 202.9p! That’s 20p in old money (pre share split) for those who harbor a grudge. The share price is now pretty much at the level of 2009, when the stock market bottomed. Unfortunately for RBS, the share price has been playing chicken with the 2 quid level for a few years but has become dangerous.

There is a slight phenomena which gives some near term hope. The BLUE downtrend on the chart dates back to September 2008. Today, this line is at 200.047p and represents the level RBS share price needs actually close below to justify hysterics. Such a triggering event will make weakness down to an initial 180p calculate as an initial point at which we’d hope for a rebound. If (when) broken, the price should eventually bottom at 150p.

Unfortunately, in the perpetual limbo dance which is RBS, we can calculate lower than 150p… To be realistic, should it ever visit the 130’s, it would become a very tempting Long position to take, just to see what will happen.

For now though, some slight hope for a near term bounce is slightly possible, due to the respect paid to the long term BLUE downtrend from 2008. If we look for immediate clues as to whether any bounce has integrity, above 207.4p calculates with an initial ambition at 211.25p. If exceeded, secondary is a bit more useful and works out at 219p. This should rebound the price to a useful level, just above the RED uptrend and hint “bottom is in”, thus giving the potential of an unusual 3rd target level at 231p, along with some almost certain hesitation.

We suspect it intends 150p eventually, once sufficient excuses for reversal accumulate.

FUTURES

Time Issued

Market

Price At Issue

Short Entry

Fast Exit

Slow Exit

Stop

Long Entry

Fast Exit

Slow Exit

Stop

Prior

2:28:10PM

BRENT

61.21

61.14

60.815

60.12

62.2

62.91

63.335

64.45

61.51

2:33:38PM

GOLD

1441.19


2:36:19PM

FTSE

7402


2:45:43PM

FRANCE

5371


2:50:04PM

GERMANY

11919

11830

11751

11725

11935

11956

11993

12046

11856

2:55:47PM

US500

2934.92


2:59:21PM

DOW

26493


3:06:53PM

NASDAQ

7698.62


3:12:47PM

JAPAN

20926


2/08/2019 FTSE Closed at 7407 points. Change of -2.33%. Total value traded through LSE was: £ 7,006,818,506 a change of 7.38%

FTSE for 2/08/2019

#DAX #SP500 We’re now in that horrible time of year, when some idiot says “how many shopping days left until ….” whereas for traders, it’s “how many market sessions until I stop pulling my hair out!”. While the markets are always mad, this year exhibits a new type of insane, one neatly shown on Thursday 1st August.

Our beef came from market movements once the FTSE closed for the day. We’d given trigger levels for the US markets, all of which managed to be exceeded in the period before 6.30pm. Quite literally, triggers were exceeded briefly by a couple of points, then it felt like someone hit the pause button. News from the USA which proved perfectly capable of trashing the Futures left an unpleasant taste as it almost felt like the markets deliberately exceeded logical trigger levels, thus capturing a bunch of orders prior to a plunge. It begs the question, isn’t this called “entrapment” in legal terms?

It can be assumed we were not amused; writing “shambles” so many times in our Prior Results column was not enjoyable.

This particular article is supposed to be about “The FTSE for Friday” but we’re a little perplexed at what the future holds. At time of writing, FTSE FUTURES are trading around 7490 points whereas the FTSE closed the session at 7581 points.

Will the FTSE, therefore, open nearly a 100 points down?

If there any point in writing “Movement now below 7535 (the opening second spike down on the 1st) looks capable of an initial 7486 points.” After all, FTSE Futures have already reached such a level whereas the FTSE itself has not. The real problem for the FTSE starts, if 7486 breaks as further reversal down to 7323 points looks valid. However, there is a pretty fair chance the market shall experience a short lived bounce around 7425, due to the presence of the prior downtrend.

We suspect the market will probably make its way down to the 7486 level and perhaps bounce a little. If this is the case, movement to an initial 7540 shall make some sense. If exceeded, secondary is at 7558 points. Should this level be bettered (remembering, we are speculating on a FTSE bounce from a level the market has not even dropped to yet!) there is a more than fair chance the drop has been an over-reaction to whatever Mr Trump did.

Curiously, any reach down to 7323 will tend suggest a coming donk against the RED uptrend, one which should generate a reasonable rebound.

FUTURES

Time Issued

Market

Price At Issue

Short Entry

Fast Exit

Slow Exit

Stop

Long Entry

Fast Exit

Slow Exit

Stop

Prior

9:43:34PM

BRENT

61.05


Success

9:46:16PM

GOLD

1444.71


‘cess

9:50:33PM

FTSE

7503.69


Shambles

9:53:27PM

FRANCE

5474.2


‘cess

9:57:51PM

GERMANY

12073.45

12031

11992

11856

12120

12120

12141.5

12178

12058

Shambles

10:01:51PM

US500

2948.62

2944

2938

2908

2985

2977

2993.75

3001

2949

Shambles

10:04:47PM

DOW

26546


Success

10:07:10PM

NASDAQ

7780.62


‘cess

10:14:50PM

JAPAN

21028


‘cess

1/08/2019 FTSE Closed at 7584 points. Change of -0.03%. Total value traded through LSE was: £ 6,525,168,165 a change of -9.28%