FTSE & SP500 for 12/07/2019

#DAX #Gold The ‘damage’ enacted by Trumps presidency continues to wreak havoc on US markets with the S&P now stronger than ever before. So are the DOW and Nasdaq! It makes a painful contrast with the UK’s “strong & stable” rhetoric while the FTSE struggles to reach any realistic growth levels. Maybe we need build yet another wall to keep Scots out, because some ideas work in unexpected ways…

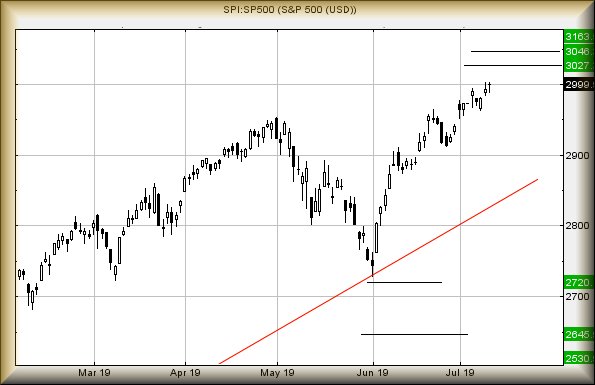
The S&P now needs better 3003 to enter a cycle toward 3027 points next, perhaps even 3046 points thanks to all the opening movement gaps. Longer term, the index now looks capable of 3163 as the next major point of interest. The market needs fall below 2875 to indicate the rising phase is starting to fail.

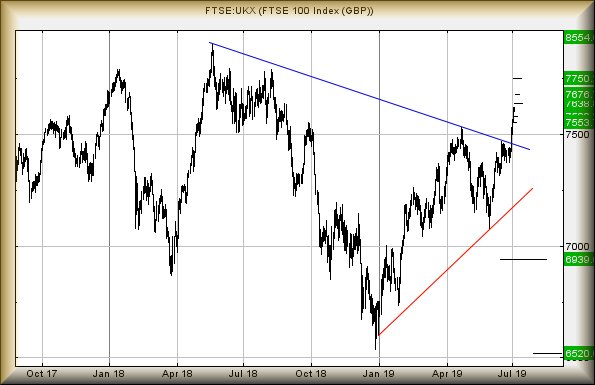
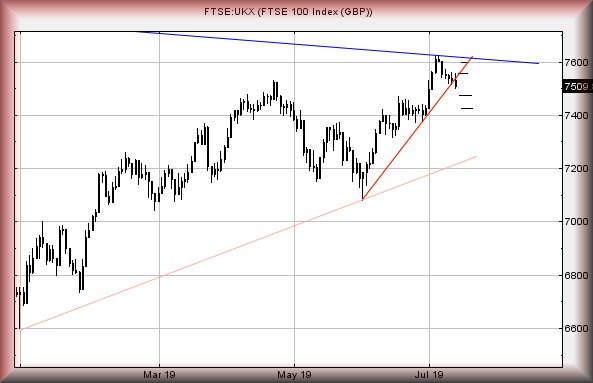
As for the FTSE and Friday, as mentioned earlier, the index continues to behave poorly and weakness now below 7500 looks capable of a near term 7473 points. If broken, secondary is at 7424 points and we’d hope for a rebound at such a level. If triggered, the tightest visual stop is at 7532 points but realistically, we’d prefer 7560 as this one appears too much like a free gift.

The converse situation, what happens if the index betters 7532 is pretty straightforward. Initially we’d look for some recovery to 7558 points. Secondary, if bettered, calculates at 7598 points.

We’re not oozing optimism, given the UK market managed to close below its immediate uptrend. Equally, if we applied similar acceleration force to those experienced in the USA, the UK should be trading around 7750 at present.

Hopefully this weekends British Grand Prix gives the UK markets a boost for next week. (clue: no chance)

FUTURES

Time Issued

Market

Price At Issue

Short Entry

Fast Exit

Slow Exit

Stop

Long Entry

Fast Exit

Slow Exit

Stop

Prior

10:38:37PM

BRENT

66.7

66.28

66.13


67.51

68.755


‘cess

10:41:03PM

GOLD

1404.49

1400

1391


1427

1431.5


‘cess

10:43:05PM

FTSE

7532.72

7500

7489.5


7560

7582


‘cess

10:46:42PM

FRANCE

5556

5548

5531


5594

5606.5


Shambles

10:48:52PM

GERMANY

12345

12304

12232


12436

12458


‘cess

10:51:29PM

US500

3000.22

2988

2982.5


3004

3009.5


10:53:29PM

DOW

27082.3

26883

26814.5


27098

27149


Success

10:56:45PM

NASDAQ

7896.12

7871

7848


7939

7956


10:58:13PM

JAPAN

21620

21522

21499


21643

21716.5


11/07/2019 FTSE Closed at 7509 points. Change of -0.28%. Total value traded through LSE was: £ 5,378,122,833 a change of 10.52%

TERN PLC for 11/07/2019

#DAX #NK225 A core ingredient in time travel stories generally revolves around the hero’s inability to arrive at the correct date and time. Back To The Future provided a great series of films and Dr Who, a continual TV series. Albeit one with currently a rubbish Doctor! We never conceal an inability to be concise with timeframes. After all, if Dr Who or Marty McFly can’t do it, who can? TERN manages to illustrate this quite neatly.

When reviewing Tern last December, (link here) we warned of the dangers below 12p as a visit to 7.5p was possible. The price broke 12p in February yet it was to take until April before it achieved our drop target, thankfully eventually bouncing by double. Since then, it has done very little other than assure the market it’s still trading by going up and down a bit. We’re not going to suspect further price recovery is upon it unless the share manages close a session above 12.65p or, trades intraday above 13.25p.

Either criteria should prove fairly significant, allegedly launching the price into a region where growth toward an initial 15.75p makes sense. Longer term (or the next day), secondary calculates at 20.5p. There is something slightly interesting about the secondary, given the prices history since October last year. A glass ceiling appears to be lying in wait and we’d be surprised if it failed to promote some hesitation in any rising cycle.

We’d be remiss if we failed to inject some misery into our thinking. Below RED, presently around 8p, would be alarming as it permits reversal to a new bottom of 4p.

FUTURES

Time Issued

Market

Price At Issue

Short Entry

Fast Exit

Slow Exit

Stop

Long Entry

Fast Exit

Slow Exit

Stop

Prior

9:48:37PM

BRENT

66.47


Success

9:50:26PM

GOLD

1418.19


Success

9:52:20PM

FTSE

7545.24


9:59:24PM

FRANCE

5575.5


‘cess

10:01:19PM

GERMANY

12383

12353

12327

12286

12434

12459

12498.5

12547

12386

‘cess

10:03:41PM

US500

2992.77


Success

10:06:27PM

DOW

26861.5


Success

10:09:07PM

NASDAQ

7902.24


Success

10:10:36PM

JAPAN

21542

21481

21430

21362

21579

21636

21665

21733

21500

Success

10/07/2019 FTSE Closed at 7530 points. Change of -0.08%. Total value traded through LSE was: £ 4,865,997,010 a change of 0.89%

UK Oil & Gas for 10/07/2019

#SPY #CAC40 Our coloured trend lines on the chart below suggest an attempt at solidarity with Pride events. However, we’re actually trying to highlight something quite different, namely when Trend Lines are rubbish! But, in proving themselves useless, they also suggest something else quite surprising.

Our review last July warned of dangers, if UKOG managed to close a session below RED on the chart. An event such as this would project the share into a region where we really cannot confident predict bottom. The intervening year has proven both deathly boring but neither has UK Oil & Gas share price drilled itself in the foot. Instead, the share price has bumbled along as if nothing has really happened.

Equally important, we’ve painted three downtrends on the chart, each of which would normally be expected to provoke reasonable movement when the share price blasted through the trend. The Light Blue line certainly afforded some slight growth, probably due to internet chatroom optimism. This flash in the pan quickly faded and the next break, through the Green downtrend provoked as much interest as a PM contenders speech.

At present, the share price is playing coyly with the Blue downtrend and we’re just not sure what will have if (or when) the price manages to kick its way through the line.

There is something worthy of consideration. Despite the share price not really going up when it betters downtrends, neither has it succumbed to temptation and crashed despite breaking the long term Red uptrend. Our best guess “bottom” projection is an obviously impossible Minus 0.5p.

The subliminal message given is of the market not being ready to give up on the share, just yet. In fact, some hope is possible, simply requiring the right type of news. At present, above 1.2p is supposed to generate slight recovery to a useless 1.5p. If exceeded, secondary is at 1.95p. Thanks to a glass ceiling existing at the 2p level, we’d need closure above this point to give real hope for the longer term as some quite vivid recovery is possible.

For now, about the only hope is straightforward. It’s neither going up nor down, so something is due to happen!

FUTURES

Time Issued

Market

Price At Issue

Short Entry

Fast Exit

Slow Exit

Stop

Long Entry

Fast Exit

Slow Exit

Stop

Prior

9:57:28PM

BRENT

64.47


9:59:06PM

GOLD

1398.08


10:01:45PM

FTSE

7542.77


‘cess

10:03:53PM

FRANCE

5578.7

5542

5512

5472

5593

5584

5593

5610

5558

‘cess

10:06:49PM

GERMANY

12458


Success

10:09:08PM

US500

2979.27

2958

2953

2938

2980

2981

2984.5

2993

2971

‘cess

10:11:32PM

DOW

26790


‘cess

10:19:37PM

NASDAQ

7826.87


‘cess

10:25:54PM

JAPAN

21527


9/07/2019 FTSE Closed at 7536 points. Change of -0.17%. Total value traded through LSE was: £ 4,822,907,600 a change of -10.55%

8/07/2019 FTSE Closed at 7549 points. Change of -0.05%. Total value traded through LSE was: £ 5,391,926,920 a change of 14.22%

Gulf Keystone for 9/07/2019

#GOLD #NASDAQ Our report on Gulf Keystone last October (link here) proved an exercise in futility. The share price has utterly failed to trigger any upward moves, instead is teasing with threats of some coming reversals. As the BLUE downtrend highlights, an impressive effort is taking place to stop it going up!

At present, trading around 221p, the price needs actually CLOSE a session above 234p before we dare make an assumption of some price recovery commencing. Such a trigger event should prove capable of an initial 257p. If bettered, secondary calculates at a longer term (and game changing) ambition of 284p. Visually, there’s a pretty firm threat of 284p, if achieved, forming some sort of glass ceiling at some point. There’s little doubt the market has placed some sort of importance at this sort of level and if we place safe, allocating above 300p as a sensible trigger level for long term recovery will make sense.

Unfortunately, more likely appears trades below 215p driving the price down to 203p initially, along with some sort of bounce. It’s critical, if 203p breaks, to remember our secondary calculates at 178p.

There is a really big problem, if the share price makes it below 165p in the future. While we can calculate 125p as a drop target, it would be worth remembering the share has entered a zone with a logical bottom down at 35p.

For now, thanks to its lack of activity in heading upward, we fear the worst for GKP’s future.

FUTURES

Time Issued

Market

Price At Issue

Short Entry

Fast Exit

Slow Exit

Stop

Long Entry

Fast Exit

Slow Exit

Stop

Prior

9:52:19PM

BRENT

63.83


‘cess

9:54:33PM

GOLD

1395.78

1391

1386

1379

1405

1408

1411.5

1420

1391

9:56:31PM

FTSE

7551.98


10:11:02PM

FRANCE

5586


10:12:53PM

GERMANY

12503


10:15:22PM

US500

2974.72


10:17:20PM

DOW

26794.4


10:27:34PM

NASDAQ

7780.15

7764

7749

7714

7804

7833

7855

7889

7770

‘cess

10:29:09PM

JAPAN

21594


‘cess


8/07/2019 FTSE Closed at 7549 points. Change of -0.05%. Total value traded through LSE was: £ 5,391,926,920 a change of 14.22%

RBS, Glencore, & Ferrari for 8/07/2019

#Brent #DAX As always, we’re launching the week with a review of last weeks predictions. Unlike politicians, we prefer not to forget things we’d said previously, especially as there is real money involved. As opposed to politicians juggling an entire countries financial future along with their career prospects.

Ferrari is proving a bit of a near term worry. The share price quite cheerfully traded beyond 165, almost touching the 170 level before a slight fallback. Our scenario allows for moves above 165 reaching 188 initially! Our slight concern comes from the share price being Gapped Up on Thursday, then Gapped Down on Friday. If the market intends play a GaGa tune, this should suggest coming weakness to 159 before any further surge upward. The issue comes, if 159 breaks, as it could easily reverse to 153 and a possible future bonk against the RED uptrend. At present, the price requires close below RED at 150p to cancel the prospect of 188 in Ferrari future.

RBS appears to have triggered movement upward toward 234p, reaching the dizzy height of 229p so far. Remarkably, it remains the case of above 234p allowing a longer term stronger rise to 253p. Unfortunately, we still distrust this share and our weasel worded demand, that the price CLOSE above 234p to force a rise to be taken seriously, remains as valid now as it was a week ago.

The retail banks had all been on board for a bit of a thrashing but the continued Brexit delays appear to have placed their share prices in a holding pattern. In plain English, we suspect drops have been delayed but not cancelled. The dangerous number for RBS remains of movement below 212p.

Glencore, while not having vanished down a rabbit hole, show little sign of avoiding such a doom. The share price still requires exceed 300p to get out of trouble though, visually, we’d raise an eyebrow if it even managed stumble above 282p as some sort of glass ceiling appears to be forming. Even above 283p now hints at 312p proving a valid ambition, along with some sort of miracle recovery. We have our doubts.

FUTURES

Time Issued

Market

Price At Issue

Short Entry

Fast Exit

Slow Exit

Stop

Long Entry

Fast Exit

Slow Exit

Stop

Prior

1:02:57AM

BRENT

64.37

62.78

62.235

61.5

63.89

64.44

64.59

65.18

63.28

Shambles

1:05:40AM

GOLD

1399


Success

1:08:06AM

FTSE

7566.95


Success

1:10:31AM

FRANCE

5601.2


Success

1:12:20AM

GERMANY

12575

12519

12465.5

12402

12619

12644

12680.5

12734

12551

Success

1:14:39AM

US500

2988.02


‘cess

1:17:00AM

DOW

26906.7


Success

1:18:40AM

NASDAQ

7830


Success

1:21:03AM

JAPAN

21682


Success

5/07/2019 FTSE Closed at 7553 points. Change of -0.66%. Total value traded through LSE was: £ 4,720,799,465 a change of 23.24%

FTSE for 5/07/2019

#DOW #Gold Once again, we spent US Indie day regretting getting out of bed. Market financial volumes hit Xmas week levels with the number of shares pretending to do anything at an absolute minimum. Why does the UK not have a couple of public holidays, dedicated to making folk feel good about themselves and their country? Perhaps this is the cunning plan for Brexit, to create a new Independence Day holiday!

We keep whinging about the media & politicians, many of which indulge in a sport of talking the future down. Unsurprisingly, these appear the same folks who warned of calamity if Mr Trump became US president, remaining gleefully highlighting anything wrong, regardless of what actually happens. Yet in the period since the US elected their disaster, the country appears better than ever with US markets achieving all time highs. It’s easy to speculate such a dreadful fate awaits the UK, once everything is shaken up by Brexit and a new clown is successfully appointed Prime Minister.

All joking aside, someone recently suggested many UK politicians (and European ones too) are utterly dreadful, because they don’t really need do a job, due to the EU indulging in heavy lifting for legislative purposes. This has created a tranche of ‘Z List’ politicians across member states, many of whom should only aspire to be local councillors at best.

The comment certainly gave some pause for thought.

One of the more common questions being asked relates to spotting early signs of proper market reversal. At present, the FTSE requires break RED on the chart, presently at 7170 points, to justify concern as this looks capable of driving the index back to the 6939 level. In itself, not the most tragic state of affairs but should 6939 break, the index risks easily trashing itself down to 6520 and a new low. This would prove a very bad thing.

On the FTSE for FRIDAY, we doubt this state of affairs risks arising anytime soon as above 7622 now looks capable of a near term 7638 points. While pretty useless, secondary at 7676 is certainly more appealing for the days ahead. Or perhaps tomorrow.

The alternate, near term, if of weakness below 7595 driving the index back to 7580 initially. If broken, secondary calculates at 7553, along with the risk of further reversals in the week ahead.

Worse still, if we examine the dire state of the US market under President Trumps domain and extrapolate a similar terrible state of affairs forward, it’s remarkably easy to calculate the UK FTSE as already on course for a long term 8554 points. It needs below the aforementioned RED line to cancel this prospect.

Have a good weekend. At time of writing, it’s 9 days and 14 hours until the British Grand Prix, along with epic traffic jams around the venue.

FUTURES

Time Issued

Market

Price At Issue

Short Entry

Fast Exit

Slow Exit

Stop

Long Entry

Fast Exit

Slow Exit

Stop

Prior

10:17:36PM

BRENT

63.12

62.86

62.37


63.7

63.87

64.165


62.86

10:19:12PM

GOLD

1415.88

1410

1399


1422

1421

1423.5


1411

10:20:44PM

FTSE

7602.22

7596

7587


7613

7623

7646


7596

10:22:34PM

FRANCE

5615.2

5612

5607


5625

5631

5641


5612

10:26:53PM

GERMANY

12635

12618

12598


12642

12660

12676


12622

10:28:55PM

US500

2999.07

2979

2974.5


3000

3000

3002


2983

10:31:55PM

DOW

26996.7

26887

26868.5


26999

27005

27046.5


26914

10:34:53PM

NASDAQ

7875.87

7854

7843.5


7881

7881

7885.5


7862

10:36:29PM

JAPAN

21673

21652

21616.5


21705

21733

21765.5


21652

4/07/2019 FTSE Closed at 7603 points. Change of -0.08%. Total value traded through LSE was: £ 3,830,628,051 a change of -34.34%

3/07/2019 FTSE Closed at 7609 points. Change of 0.66%. Total value traded through LSE was: £ 5,833,923,345 a change of -4.39%

RBS for 4/07/2019

#DOW #GOLD We’d tried to skip RBS in our Retail Bank analysis recently. Essentially it proved difficult to whip up enthusiasm for a months price moves which frankly make the UK PM contest seem exciting and vibrant. However, there are slight signs things with RBS are about to become slightly interesting.

Movements now above 225p indicate the prospect of some recovery in the near future with 234p calculating as an immediate prospect. If this ambition appears, there’s a fairly firm suggestion we’ve spent the last year scanning movements against The Wrong Trend! What alarmed us this week was how the share price opened on Monday. The market opted to gap the price up, suggesting “they” were skipping over a trend. If this proves the case and 234p makes an appearance anytime soon, our secondary, if bettered, calculates at 253p.

We have considerable doubts regarding this and the lower chart gives a fairly straightforward visual excuse. It appears the market is asking us to believe RBS share price was jumped across a downtrend which started in 2008! We’re just a little sceptical about this, if only due to RBS previously triggering what seemed a solid movement down to 202p.

In theory, our 202p target level is now void but on this occasion, our inclination is to distrust software and instead fear the worst. After all, we’ve identified a market strategy when a share price is magically Gapped UP, then Gapped DOWN a few days later. This tends indicate a price is about to be roasted.

For RBS, this will mean weakness below 212 should propel the share down to 202p initially with secondary, if broken, at 177p. In fact, it could easily tumble to 149p eventually with the correct blend of toxic news and market conditions polluted by UK politics.

For now, we shall watch carefully for the price actually closing above 234p as this should make future tumultuous drops difficult.

FUTURES

Time Issued

Market

Price At Issue

Short Entry

Fast Exit

Slow Exit

Stop

Long Entry

Fast Exit

Slow Exit

Stop

Prior

10:15:30PM

BRENT

63.8


10:18:30PM

GOLD

1419.29

1411

1405

1394

1423

1430

1441

1461

1412

‘cess

10:20:42PM

FTSE

7619.98


‘cess

10:22:38PM

FRANCE

5630.7


Success

10:35:46PM

GERMANY

12659


‘cess

10:37:52PM

US500

2997


Success

10:40:27PM

DOW

26982

26820

26766

26692

26950

26990

27028.5

27170

26840

Success

10:42:12PM

NASDAQ

7862


‘cess

10:44:07PM

JAPAN

21713


Success

3/07/2019 FTSE Closed at 7609 points. Change of 0.66%. Total value traded through LSE was: £ 5,833,923,345 a change of -4.39%