Ted Baker for 12/06/2019

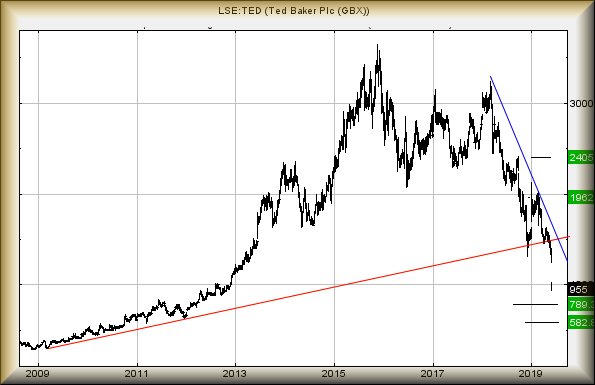
#DOW #NASDAQ Last time we reviewed Ted Baker was in December last year (link here) and the results since have proven quite spectacular. Successfully predicting a rise, while expecting a share price to fall is something fraught with danger. Somehow, Ted Baker managed fulfil all criteria, going up, meeting targets and then heading down anyway. Slightly mad!

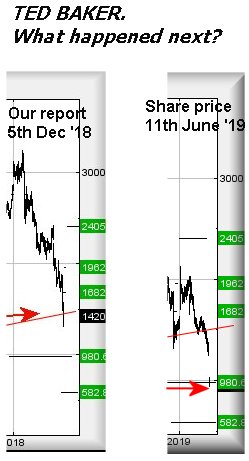
For now, the issues are fairly straightforward. We’d projected 980 as a fairly major point of interest – in a drop cycle which was yet to happen last December – and now, the share has broken below such a point, closing at 955p on 11th June 2019. As a result, we’re pretty far from convinced Ted Baker is “cheap” and worthy of any attention. Instead, it now appears ongoing weakness below 939 looks capable of continued reversal toward 789p next. It’s absolutely crucial 789p is not breached on an initial surge downward of “real” bottom, the point at which we’d hope for a bounce with some integrity, calculates at 582p.

We cannot reliably calculate any drop target below 582p which is not prefaced with a minus sign…

Now we are reassured as to which trend TED is adhering (clue: RED) the share apparently needs better 1545 simply to regain the trend. We’ve considerable doubts this shall prove possible anytime soon as it appears the market is intend on starting a brand new trend for the share. In fact, at present it requires exceed 1122p just to give a slight hint the drop has been overcooked (which does happen). But for now, there’s a strong argument suggesting Ted Baker is hanging on “a shoogly peg”, to employ an apt Scottish term.

Should it reach 582p, we shall become very interested in what comes next.

FUTURES

Time Issued

Market

Price At Issue

Short Entry

Fast Exit

Slow Exit

Stop

Long Entry

Fast Exit

Slow Exit

Stop

Prior

10:25:05PM

BRENT

61.76


10:26:35PM

GOLD

1327.76


‘cess

10:30:30PM

FTSE

7393.37


‘cess

10:33:23PM

FRANCE

5401


‘cess

10:35:53PM

GERMANY

12150.42


‘cess

10:41:35PM

US500

2887.07


10:43:58PM

DOW

26058.7

25990

25932

25836

26189

26258

26278

26444

26050

‘cess

10:45:38PM

NASDAQ

7514.92

7486

7448.5

7399

7544

7597

7618

7662

7526

‘cess

10:47:53PM

JAPAN

21184


‘cess

11/06/2019 FTSE Closed at 7398 points. Change of 0.31%. Total value traded through LSE was: £ 5,447,131,649 a change of 38.68%

10/06/2019 FTSE Closed at 7375 points. Change of 0.6%. Total value traded through LSE was: £ 3,927,877,834 a change of -29.61%

Woodford Patient Cp Trst for 11/06/2019

#Gold #SP500 In a welcome respite from Brexit nonsense, we’ve noticed Google News Business section has been dominated with a new subject. Hedge Fund guru, Neil Woodford, has a vehicle traded on the FTSE250 with the price recently getting a little bit of a hammering. It has provoked emails!

To be honest, we’d never heard of the bloke until he became famous for all the wrong reasons but, despite receiving emails regarding WPCT, we’d probably be covering it anyway. The share price is doing something almost interesting. From our perspective, the issue is fairly simple; where’s bottom going to be?

The answer, thankfully, is equally simple but what really interests us are two distinctly different calculations. Whether we employ Big Picture arguments or near term, we’re calculating a bottom price anytime soon. (Bottom, obviously not ever guaranteed, is the level at which we’d hope for a substantial rebound)

In the case of Woodford, it appears continued weakness below 58p faces reversal to an initial 55p with secondary, if broken, at 52.6p. The proximity of each number tends give hope the price to stop falling. We cannot calculate below these levels with any degree of accuracy – or hope. Working on the hope the market intends designate bottom in the 50’s, how high could it be expected to bounce? At this point, we’ve got to abandon our software to a certain extent and simply review the visuals. Any initial bounce would make sense to attempt an initial 75p, essentially making a challenge of the manipulation gap in the company share price. Our secondary, if such a level is bettered, comes along at a doubtful 86p, challenging the downtrend since 2017.

Finally, to inject common sense into the discussion, please remember we cannot calculate a target below 52.6p.

FUTURES

Time Issued

Market

Price At Issue

Short Entry

Fast Exit

Slow Exit

Stop

Long Entry

Fast Exit

Slow Exit

Stop

Prior

10:12:54PM

BRENT

62.03


‘cess

10:15:29PM

GOLD

1328.62

1324.6

1321.5

1313

1333

1331

1333

1336

1324

10:38:07PM

FTSE

7371.28


‘cess

10:39:19PM

FRANCE

5373.4


10:41:50PM

GERMANY

12102


10:44:10PM

US500

2889.27

2869

2864

2850

2893

2906

2924

2952

2868

‘cess

10:46:55PM

DOW

26085


‘cess

10:50:21PM

NASDAQ

7515.55


Success

10:52:22PM

JAPAN

21118


‘cess

10/06/2019 FTSE Closed at 7375 points. Change of 0.6%. Total value traded through LSE was: £ 3,927,877,834 a change of -29.61%

GBPEUR on 10/06/2019

#Brent #DAX Sometimes this pair defies any sort of logic but, as projected last month (link here), the relationship indeed met criteria and founders from the 1.17 level down to the 1.12 level. We suspect, given the calibre of politicians involved, this was almost like predicting rain in Scotland – inevitable.

At present, the pairing needs above 1.13 just to exceed the immediate pace of descent but we shall be more interested only if it somehow exceeds 1.14 and rises to 1.1503. While fairly insignificant, things get a little more interesting if 1.153 is bettered. This will tend imply some strength is present, indicating the potential of growth toward 1.169 next. Calculating above 1.169 is a bit dodgy but the key trigger level for “proper” movement of 1.20 still appears viable.

However…

We’re occasionally mentioning “on the first surge” to highlight something useful about our target levels. For instance, the graphic above highlights that on May 31, GBPEUR achieved our 1.1285, even closing the session at exactly this level. But importantly, during the session, it broken below to 1.1268. In plain English, this created a scenario where regardless of what followed, our secondary drop target became viable.

The situation now is fairly plain as anything now below 1.12 looks very capable of travel down to an initial 1.1092 next. Secondary, if (when) broken on the first surge is at a bottom, hopefully, of 1.085. In conventional circumstances, we’d already feel comfortable assuming GBPEUR is already heading down to the 1.085 level. Below such a point will require another hard stir of the tea leaves.

FUTURES
Time Issued Market Price At Issue Short Entry Fast Exit Slow Exit Stop Long Entry Fast Exit Slow Exit Stop Prior
4:17:54PM BRENT 63.03 61.47 61.045 60.3 62.85 63.28 63.54 64.23 61.96 ‘cess
4:21:54PM GOLD 1340.96                 ‘cess
4:26:40PM FTSE 7349.73                 ‘cess
4:29:10PM FRANCE 5362.7                 Success
4:30:59PM GERMANY 12068.31 11962 11922.5 11864 12061 12098 12160.25 12238 11962 ‘cess
5:12:01PM US500 2875                 Success
5:21:37PM DOW 26014                 Success
5:49:44PM NASDAQ 7420                 Success
5:51:29PM JAPAN 21048                 Success
7/06/2019 FTSE Closed at 7331 points. Change of 0.99%. Total value traded through LSE was: £ 5,580,216,359 a change of 12.51%

FTSE for FRIDAY 7/06/2019

#Gold  #SP500 With an interesting level of discretion, the FTSE has spent the last week scaring us silly! The problem was fairly simple. The market had broken the RED line on the chart below, moving the index into the land of pestilence, famine, dinosaurs, and rabid politicians. And then it changed…

Our thinking last week suggested a drop coming to 7106 points, something the market actually achieved on the Monday. Worse, it even broke below this level, eventually opting to rebound from 7079 points. The entire charade of reversals was played out in just 46 minutes, after the market opened for trading. In the week since, continued small daily gains now make us wonder if the FTSE just did a “gotcha” on those folk taking short positions, once they’ve assessed the competence of our countries leadership. The point at which the FTSE closed the day on Friday has tended, if we apply our usual logic, spoil any immediate drop potential.

Here’s the thing – to quote Simon Cowell. (when he struggles to find new ways to avoid saying “deluded”)

The RED line on the chart, the uptrend since the start of January, is presently at 7250 points.

Alternately, the trend from the market lows of December 2018 is presently at 7258 points.

The FTSE closed Thursday at 7259 points.

If the market were a share, we’d be inclined to regard the drop to 7079 points on Monday as “fake” and instead, opt to take a more optimistic view for immediate future.

Near term, FTSE movements above 7285 should attempt recovery to an initial 7313 points. Our secondary, if bettered, calculates at 7392 points and given the pace of market movement recently, it’s unlikely to come along at a rush. The tightest stop loss level appears to be pretty wide at 7228 points.

There are some interesting potentials if 7228 breaks at travel down to 7197 appears likely. If broken, secondary is at 7151 points.

 Finally, there is a further important facet of the recent drop to 7107. The market proved the ruling uptrend can be broken, meaning any future break below 7107 is liable to promote a swift, almost 300 point, drop to the 6800’s.

Have a good weekend; it’s the  Montreal F1 Weekend and almost time for Ferrari to ritually humiliate themselves again.

FUTURES

Time Issued

Market

Price At Issue

Short Entry

Fast Exit

Slow Exit

Stop

Long Entry

Fast Exit

Slow Exit

Stop

Prior

10:00:21PM

BRENT

62.03

59.95

59.24


62.18

62.445


10:01:59PM

GOLD

1335.99

1326

1320.5


1340

1344


10:10:36PM

FTSE

7266

7210

7200


7285

7312


10:17:04PM

FRANCE

5281

5258

5237.5


5335

5342.5


Success

10:19:44PM

GERMANY

11971.02

11893

11850


12012

12081


Shambles

10:28:22PM

US500

2840.62

2819

2807


2845

2851.25


‘cess

10:33:04PM

DOW

25700

25498

25374.5


25805

25853


Success

10:35:12PM

NASDAQ

7264.74

7199

7159


7294

7318


‘cess

10:37:03PM

JAPAN

20843

20734

20664


20907

20946


6/06/2019 FTSE Closed at 7259 points. Change of 0.54%. Total value traded through LSE was: £ 4,959,645,738 a change of -22.72%

5/06/2019 FTSE Closed at 7220 points. Change of 0.08%. Total value traded through LSE was: £ 6,417,553,392 a change of 4.62%

SSE for 6/06/2019

#DOW #DAX For some reason, we’ve had a flurry of emails regarding energy company share prices and we’ve opted on SSE to run an analysis against. Something a bit funny appears to be happening across the entire sector. It’s showing the chances of some fairly near term recovery, against a backdrop of the big picture suggesting downward travel.

The immediate suggestion for SSE is of movement above 1111p indicating the potential of coming travel to 1182p. At best, this challenges the downtrend since last year and if above, further oomph toward 1313p becomes possible. But as always, there’s a problem.

Circled on the chart are three price movements, opening second gaps. From Left to Right, they imply the market said “this price should go down”. Then, the next one says, “yes, you recovered but we really want the price down”.

And finally, “Look, stay down. We’ve told you twice already!”

While we’re taking a rather whimsical approach, visually there can be no doubt the market REALLY expects SSE share price to relax. As a result, the big question is to where?

It looks like weakness now below 1000p shall drive the share down to 939p next. If broken, secondary calculates at 894p but we really suspect it shall have difficulty closing a day below 939p. The reason for this is fairly simple – it moves the share price into a region with the big picture demanding reversal to 683p ultimately.

To cut to the chase, our belief is, should SSE Plc reach 939p, it may well prove worth a look to catch any bounce coming.

FUTURES

Time Issued

Market

Price At Issue

Short Entry

Fast Exit

Slow Exit

Stop

Long Entry

Fast Exit

Slow Exit

Stop

Prior

10:20:36PM

FTSE

7230


‘cess

10:24:05PM

BRENT

60.29


‘cess

10:26:00PM

GOLD

1330.94


Success

10:28:46PM

FRANCE

5295.5


‘cess

10:30:17PM

GERMANY

11992.71

11926

11898

11845

12017

12057

12080.5

12132

11950

‘cess

10:34:42PM

US500

2827.62


Success

10:37:00PM

DOW

25549

25330

25283.5

25191

25511

25561

25618.75

25765

25376

‘cess

10:42:47PM

NASDAQ

7225.32


‘cess

10:44:25PM

JAPAN


Success


5/06/2019 FTSE Closed at 7220 points. Change of 0.08%. Total value traded through LSE was: £ 6,417,553,392 a change of 4.62%

Boeing for 5/06/2019

#Nasdaq #CAC40 As the US President is visiting the UK, it made sense to review the maker of the aircraft in which he flies the world. If only the UK still had an indigenous maker of commercial jets, our PM could be poncing around the British Empire in an elegant DH Comet. Or half a Concorde (it was 50% French)!

As the throwaway headline above from Google News highlights, Boeing (currently trading at 343) do not need seek problems at present but their share price is proving fairly resilient – so far anyway. We do have issue with movements this year as they suggest a future descent below 330 shall attempt a landing down at 317. We expect any bounce from this level to prove short lived as there’s a heck of an argument favouring 275 as bottom. Hopefully.

A glance at the chart immediately throws up issues with an ambition at 275.

Firstly, and quite importantly, in the event 275 makes an appearance, the share will have broken the uptrend since 2016.

Secondly, and very importantly, if 275 appears, it presents a “lower low” in the grand scheme of things, taking the share into territory where a long term logical bottom is down at 175.

Third (this one is obscure) the visuals indicate the share price has now real “history” at 275. This is the sort of thing, when if a share has previously hit a high (or a low) there will be ample reason to anticipate market activity when it next revisits such a level. The best we’ve got is a couple of days in December 2017 when the price hit this level and basically did nothing interesting. We’d be hard pushed to invent a reason why this will prove important.

Collectively, the foregoing encompasses sufficient reason to distrust 275 if – and only IF – it makes an appearance. Do remember none of our criteria are yet present to justify such a dollop of misery for the future.

We suspect the circled area on the chart represents Boeings most recent aircraft incident. It feels very like the market decided, “okay, let’s start a new trend” at this point and thus, we’ve painted a Blue line. At present Boeing require better 358 just to indicate the potential of a climbing cycle to 386. If we adhere to our demand for “higher highs”, only above 365 does it actually become safe to believe in 386 as a future potential. Secondary, if such a level exceeded, calculates at an improbable 429.

We deem this improbable as it takes the price above the circled area on the chart, carrying a subliminal suggestion all is okay again in Boeings world.

For now, we’re just not sure the market has figured out a plan for this aircraft maker as the share price is on a wing and a prayer. (sorry, couldn’t resist)

FUTURES

Time Issued

Market

Price At Issue

Short Entry

Fast Exit

Slow Exit

Stop

Long Entry

Fast Exit

Slow Exit

Stop

Prior

10:09:12PM

BRENT

61.24


10:10:45PM

GOLD

1325.46


10:13:38PM

FTSE

7228.28


‘cess

10:16:36PM

FRANCE

5275.3

5189

5178

5144

5241

5279

5286.5

5332

5250

Success

10:25:12PM

GERMANY

11992.71


Success

10:29:02PM

US500

2808


Success

10:32:05PM

DOW

25408


Success

10:34:07PM

NASDAQ

7202

7124

7095.5

7060

7180

7202

7207.25

7246

7131

‘cess

10:36:49PM

JAPAN

20726


Success


4/06/2019 FTSE Closed at 7214 points. Change of 0.42%. Total value traded through LSE was: £ 6,134,245,943 a change of 11.89%

Kier Group for 4/06/2019

#Gold #SP500 We received a few emails, asking if Kier was at “bottom” following the thrashing their share price received. We suspect last months news of their Finance Director “stepping down” should have provided sufficient warning something was brewing but a minus 41% day was not fun to watch.

Amazingly, there is a chance it has indeed bottomed at 157p and we’d normally hope for a bounce at this level. There is one important warning worthy of consideration and it’s fairly simple. If, for any reason, the price now CLOSES below 157p, we can calculate 70p with some bottoming potentials. And that’s it. Anything else produced now is prefaced with a minus sign.

In normal circumstances, we’d hope 157p shall indeed produce some sort of rebound and anything now continuing above 176.5p calculates with an initial target at 187p. If exceeded, our secondary comes in at 195p. Only in the event of 195p being exceeded dare we start to suspect a rebound shall prove genuine as a surge to 234p becomes possible.

Instead, our suspicion is of 157p being used as “bottom” in the days ahead, essentially permitting the price to bounce around for a while within the 157 to 195 range. By any standards, this looks a fairly useful trading range. But do remember, below 157p and our last chance saloon calculates at 70p.

FUTURES

Time Issued

Market

Price At Issue

Short Entry

Fast Exit

Slow Exit

Stop

Long Entry

Fast Exit

Slow Exit

Stop

Prior

9:44:49PM

BRENT

60.65


9:47:36PM

GOLD

1325.18

1315

1311.5

1306

1322

1329

1333

1337

1317

Success

9:51:28PM

FTSE

7181.49


‘cess

9:54:52PM

FRANCE

5212


‘cess

9:57:37PM

GERMANY

11781


‘cess

10:00:50PM

US500

2753.47

2728

2719.5

2705

2756

2759

2770

2784

2730

Success

10:03:34PM

DOW

24913.3


‘cess

10:14:41PM

NASDAQ

7007


Success

10:17:06PM

JAPAN

20466


3/06/2019 FTSE Closed at 7184 points. Change of 0.32%. Total value traded through LSE was: £ 5,482,318,387 a change of -12.64%