Just thinking aloud,#DeLaRue (LSE:DLAR) dare not be regarded as cheap until 234p. Currently at 302p. But if 234p breaks, we shall tend think of 15p as being cheap. As for The Deer, our market analysis received 10% of the views this snapshot of a bambi achieved.
We remain humbled at the volume of folk who read our Friday missive, visiting from all around the world. For the first time ever, we get to say “hi” to folk in Zimbabwe, making a surprise visit last week. Googles Analytics service remains addictive, giving the excuse for a wasted 30 minutes.
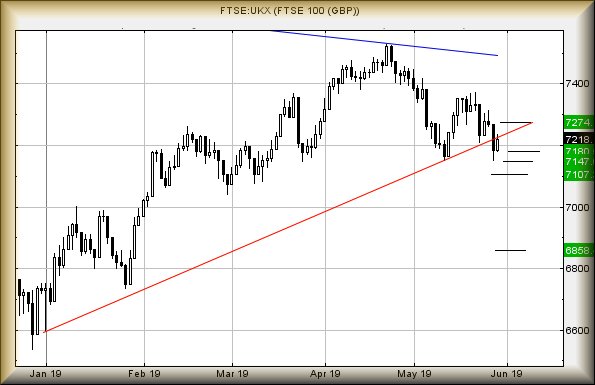
As for the FTSE for Friday, we lack confidence for the
day. In theory, above 7232 should now promote a visit to 7245 points initially.
Secondary, if bettered on the first upward surge, calculates at a more useful
7274 points. If triggered, the tightest stop is at 7198 points.
What happens if 7198 breaks?
We’d expect weakness down to an initial 7180 points. If
broken, secondary is at 7147 points. If triggered, the tightest stop looks like
7230 points.
The water is further muddied by the fact Friday is the
last day of a month. For some reason, this often sees logic abandoned, faster
than a politicians stance on Brexit. Our feeling earlier in the week for to
expect the FTSE to eventually reverse and hit a “bottom” at 7106 points. Perhaps
some indicators are due to be released which shall justify a really grotty end
to the month.
Additionally, it is worth pointing out the FTSE has now
slithered below the uptrend for 2019, this tending suggest long positions risk
trouble unless the index betters 7137 points, regaining the trend.
#SP500 #DAX Our
last in-depth look at Sirius was back in February at 20p (link
here) and it has been getting seriously close to our 13p target.
Interestingly, since their Open Offer deal, a few pundits are suggesting the
share price is now undervalued, even proposing some interesting rise potentials.
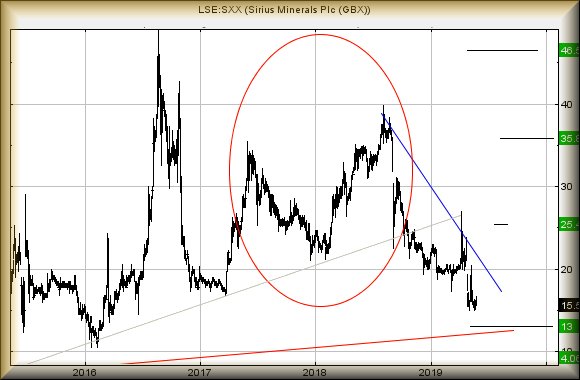
So, is it at bottom?
To be honest, we’re not sure. The price is certainly
hovering at the 15p level, giving an indication a “floor” has been found. With
our distrust of the way in which the market treats investors, we’d be
uncomfortable suggesting it’s at bottom, if only due to the price floundering
around in “lower low” territory. There can be little doubt trades now below
14.95p should provoke reversal to 13p and visually a bounce.
Consider this. If the price were somehow to close below
13p, actual bottom should prove to be at around 4p!
The folk who believe in chart patterns should not be
confused with those who follow horoscopes or technical indicators. Quite often,
a complex sounding chart pattern is simply describing a logical mental process.
The current one potentially effecting SXX is circled in RED on the chart. The
first peak is the “Hey, I don’t think it will get higher, I’m taking profit”
sentiment. The second peak echoes the initial one. And the third peak is fairly
simple; “It’s had a good run, don’t trust it now, I’m out of here”.
At this point, another force takes over; “Ooops, it has
broken the immediate uptrend again. Think I’ll just wait and see.”
And before you know it, you’ve got a classic Head &
Shoulders formation, one which points at reversal to 4p eventually. Essentially,
it’s entirely based on how a trader will view price movements, along with the
emotional cycle. More often than not, it works out, even if you have to squint a
bit to recognise the chart pattern.
Our own thinking is of reversal coming to 13p anytime
soon, along with a bounce at such a point. The RED uptrend dates back to 2010
and should prove perfectly capable for traders to pile in, with the belief such
a long term uptrend must provoke a rebound.
At present, any rebound exceeding 22p should bring a
visit to an initial 25.5p. If exceeded, secondary calculates at 35p in the
future. In fact, we can even compute a best case scenario at 46p, a point where
we’d again stir the tea leaves.
For now, it feels like 13p shall prove worth watching
for.
Galliford Try #Gold #SP500
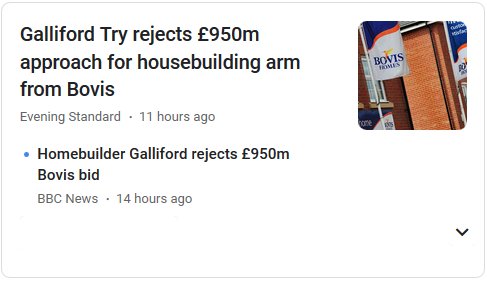
The often confused “we want to buy you, then you want to
buy us” events surrounding Galliford Try and Bovis appear to be concluded for
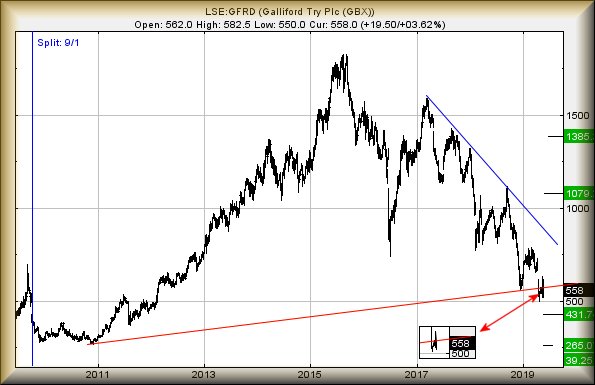
now. We last reviewed Galliford in February last year, when the price was 800p.
Our initial drop potential was 696p – achieved – with secondary (when broken) at
308p. Any changes?
We’ve a slight suspicion Bovis may have dodged a bullet
here as the share price is trading below its last ditch uptrend since 2010.
There are a couple of important thoughts pertaining to its current position.
Weakness now below 499p looks capable of entering a cycle down to 431p
initially. We’d hope for a bounce at such a level but if broken, secondary
calculates at 265p.
Rather worse is the calculation of the share price now
trading in a region where “ultimate” bottom (the level we cannot calculate
below) is at 39p. Obviously, this is the sort of ridiculous drop which usually
requires some really grotty news issued.
At present, the share requires better 850p, just to
signal the immediate pace of descent has eased. Such a miracle allows recovery
to an initial 1079p. If bettered, secondary is at a longer term 1385p.
For now, it appears dangerous but perhaps worth
watching for 265p making an appearance at some point. After all, folk will
look at the lows of 2009 and 2010 and judge, for this reason alone, a bounce can
be expected.
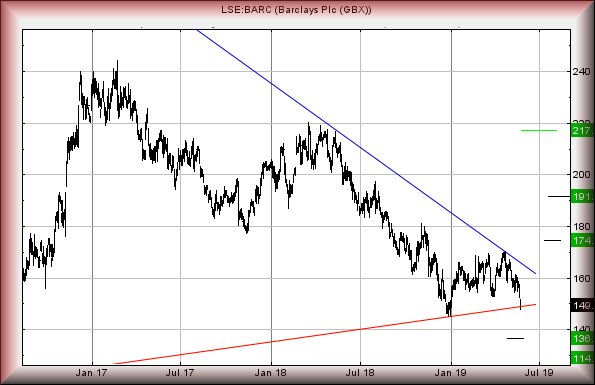
Barclays, #Brent, #DAX
Our previous review of Barclays (link
here) had a pretty miserable expectation, should the share price break below
our drop target. Unfortunately, this has now happened and there’s the slimmest
of margins inhibiting it opening the gates of gloom. The problem number is
currently 148.82p.
Absolutely nothing to do with Barclays. Google
News algorithms can be odd!
In the event Barclays closes a session below 148.823p,
we’re looking for traffic down to an initial 136p. To be blunt, if it even
trades below 147p, it shall be viewed as entering this reversal cycle. Our
secondary, if 136p breaks, calculates at 114p. It’s rather worrying to note,
we’ve two quite distinct arguments suggesting Barclays share price intends take
a visit down to the 114p level eventually. About the only encouraging signal
left is fairly simple. The share has NOT yet closed below the RED uptrend since
2009, hence our fascination with 148.823p. However, the share price has broken
below this trend during the last two sessions, so we’d be far from confident the
trend line shall hold.
There’s obviously the risk of the somewhat confused
series of political results from the EU election entering the fray, if any of
the mainstream politicians actually can decide what they stand for. At present,
Barclays requires exceed 165p to convince us it has exited the drop zone to 136p
eventually. Visually, there’s quite a strong suggestion the price will head to
136p, execute some sort of short lived bounce, then eventually wander downward
to 114p.
It needs exceed 166p to signal our misery is misplaced,
allowing recovery to an initial 174p. If bettered, secondary is at 191p.
#Gold #SP500 As we
live through the final days of a failed political career, it’s easy to imagine
the abrupt downward surge on the FTSE was a direct result of the UK’s “Strong
and Stable (aka, Weak and Shoogly)” governance. We’re fairly confident drops
experienced on Thursday had nothing to do with the Prime Minister.
It all goes back to a market movement, worldwide, on
Wednesday. Sharp eyed readers viewing our evening UK Futures noted we used the
word “Shambles” to describe the previous days results. Our preference,
obviously, is to use “Success” or ” ‘cess”, denoting whether one or two targets
were achieved. We only employ “Shambles” when market behaviour makes absolutely
no sense. Only once the day was over and tempers calmed did we start to suspect
what had happened.
At 13:26 on Wednesday, a whole bunch of indices both in
Europe and the USA dropped, for a couple of seconds, below levels we’d designed
as key trigger levels to open SHORT positions. Once these short positions
triggered, the indices immediately reversed direction, spending the following 90
minutes climbing above logical Stop Loss levels for each and every one of the
SHORT positions.
Thus, the trades would be cancelled and traders left
out of pocket. A co-ordinated effort, internationally, reminded us sharply why
we avoid comment on Forex unless from a Big Picture perspective. This sort of
market behaviour, in our opinion, is rather lacking in ethics. The following
private note was included on Wednesday evening for our clients;
“With
shares, I tend regard this as a clear warning signal for a coming drop with the
market opting to trigger a bunch of trades with attractive stop loss levels.
This essentially clears out the folk who were poised to take advantage of coming
reversals.”
Markets dropped sharply on Thursday, as feared. But
behaviour on Wednesday was clearly designed to wipe out SHORT positions, prior
to the drop!
Our tantrum over, what’s next?
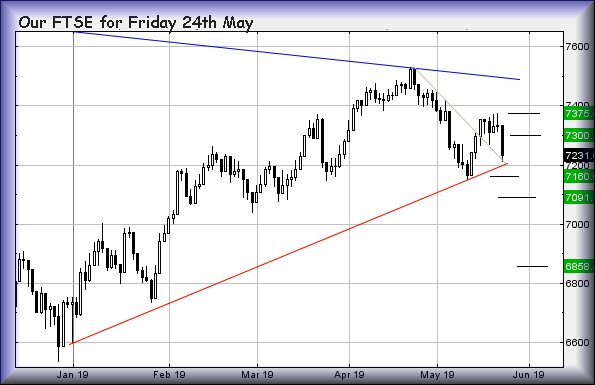
The FTSE actually dropped further than we’d like. It
closed Thursday at 7230 points and now lurks with the threat of weakness below
7210 bringing travel down to 7160 points next. Our secondary, should 7156 break,
calculates at 7091 points.
If triggered, the tightest stop level looks like 7270
points. But given market behaviour as listed previously, we’d prefer wider still
at 7301 points.
We’ve an obvious disparity between a drop target 7160
and trigger level of 7156. This is fairly simple, due to the FTSE being
manipulated (gapped) downward by 14 points at the open on Thursday morning.
Essentially, this nonsense confuses our software.
What happens if the FTSE exceeds 7270 points? Initially
we’re looking for 7300 points. Our secondary, if such a point exceeded,
calculates at 7375 points. If triggered, the tightest stop is at 7210 points.
Perhaps it is also worth mentioning the index (somehow)
remains above the 2019 Red uptrend on the chart below. We’re far from
comfortable this state of affairs shall continue.
On a brighter note, it’s the Monaco GP this weekend,
possibly the most boring race on the F1 calendar yet one which makes compulsive
viewing in the hope something happens. Have a good weekend.
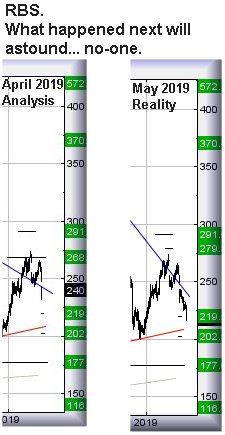
RBS #SP500 #NK225
In our monthly visit to “The Bank that likes to say ‘Doh!’ “, the star of the
clown sector of the FTSE has performed pretty much as expected. Our prior report
(link
here) was notable in lacking any confidence for an immediate share price
recovery and now, we require to examine what the break of our initial target
risks?
With the share price breaking below 219.5p, it enhances
the probability of any near term bounce being short lived. When we review the
immediate downtrend, the demand is for anything above 228 apparently suggesting
the speed of descent has eased, allowing recovery to an initial 235p. This,
while fairly useful, unfortunately ensures the share price remains in the drop
zone with 202p offering the chance of a probable “real” bottom.
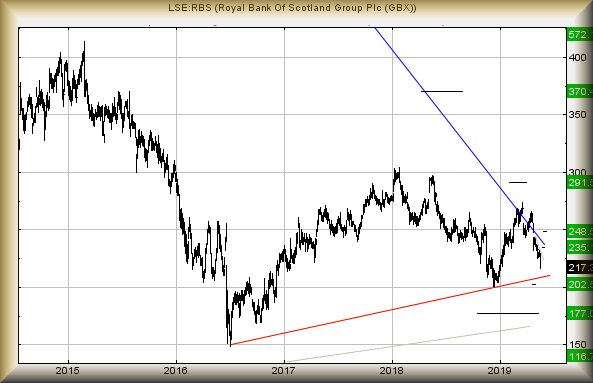
Only above 238 shall we start taking any recovery
seriously as this will trash the immediate drop prospects and take the share
into a region where 248 presents a target.
For now, below 216 still suggests 202p as providing a
“bottom” but secondary, if broken, comes along at 177p eventually.